
Updated on June 29th, 2026 by Bob CiuraSpreadsheet data updated daily
In the world of investing, volatility matters. Investors are reminded of this every time there is a downturn in the broader market and individual stocks that are more volatile than others experience enormous swings in price in both directions.
That volatility can increase the risk in an individual’s stock portfolio relative to the broader market.
The volatility of a security or portfolio against a benchmark – is called Beta. In short, Beta is measured via a formula that calculates the price risk of a security or portfolio against a benchmark, which is typically the broader market as measured by the S&P 500 Index.
When stock markets are rising, high-beta stocks could outperform. With that in mind, we created a list of S&P 500 stocks with the highest beta values.
You can download your free High Beta stocks list (along with relevant financial metrics such as dividend yields and price-to-earnings ratios) by clicking on the link below:

It is helpful in understanding the overall price risk level for investors during market downturns in particular.
High Beta stocks are not a sure bet during bull markets to outperform, so investors should be judicious when adding high Beta stocks to a portfolio, as the weight of the evidence suggests they are more likely to under-perform during periods of market weakness.
However, for those investors interested in adding a bit more risk to their portfolio, we’ve put together a list to help investors find the best high beta stocks.
This article will provide an overview of Beta. In addition, we will discuss how to calculate Beta, incorporating Beta into the Capital Asset Pricing Model, and provide analysis on the top 5 highest-Beta dividend stocks in our coverage database.
The table of contents below provides for easy navigation:
Table of Contents
High Beta Stocks Versus Low Beta
Here’s how to read stock betas:
A beta of 1.0 means the stock moves equally with the S&P 500
A beta of 2.0 means the stock moves twice as much as the S&P 500
A beta of 0.0 means the stocks moves don’t correlate with the S&P 500
A beta of -1.0 means the stock moves precisely opposite the S&P 500
The higher the Beta value, the more volatility the stock or portfolio should exhibit against the benchmark. This can be beneficial for those investors that prefer to take a bit more risk in the market as stocks that are more volatile – that is, those with higher Beta values – should outperform the benchmark (in theory) during bull markets.
However, Beta works both ways and can certainly lead to larger draw-downs during periods of market weakness. Importantly, Beta simply measures the size of the moves a security makes.
Intuitively, it would make sense that high Beta stocks would outperform during bull markets. After all, these stocks should be achieving more than the benchmark’s returns given their high Beta values.
While this can be true over short periods of time – particularly the strongest parts of the bull market – the high Beta names are generally the first to be sold heavily by investors.
One potential theory for this, is that investors are able to use leverage to bid up momentum names with high Beta values and thus, on average, these stocks have lower prospective returns at any given time.
In addition, leveraged positions are among the first to be sold by investors during weak periods because of margin requirements or other financing concerns that come up during bear markets.
While high Beta names may outperform while the market is strong, as signs of weakness begin to show, high Beta names are the first to be sold and generally, much more strongly than the benchmark.
Indeed, evidence suggests that during good years for the market, high Beta names capture 138% of the market’s total returns.
In other words, if the market returned 10% in a year, high Beta names would, on average, produce 13.8% returns. However, during down years, high Beta names capture 243% of the market’s returns.
In a similar example, if the market lost 10% during a year, the group of high Beta names would have returned -24.3%. Given this relatively small outperformance during good times and vast underperformance during weak periods, it is easy to see why we prefer low Beta stocks.
While low Beta stocks aren’t a vaccine against downturns in the market, it is much easier to make the case over the long run for low Beta stocks versus high Beta given how each group performs during bull and bear markets.
How To Calculate Beta
The formula to calculate a security’s Beta is fairly straightforward. The result, expressed as a number, shows the security’s tendency to move with the benchmark.
Therefore, a Beta value of 1.00 means that the security in question should move virtually in lockstep with the benchmark (as discussed briefly in the introduction of this article).
A Beta of 2.00 means moves should be twice as large in magnitude while a negative Beta means that returns in the security and benchmark are negatively correlated; these securities tend to move in the opposite direction from the benchmark.
This sort of security would be helpful to mitigate broad market weakness in one’s portfolio as negatively correlated returns would suggest the security in question would rise while the market falls.
For those investors seeking high Beta, stocks with values in excess of 1.3 would be the ones to seek out. These securities would offer investors at least 1.3X the market’s returns for any given period.
Here’s a look at the formula to compute Beta:
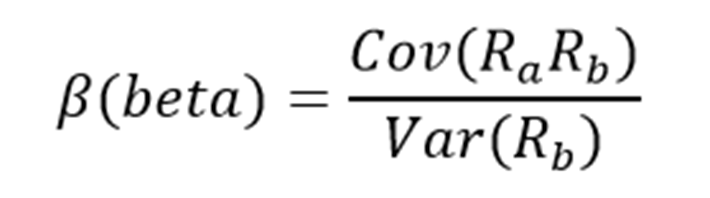
The numerator is the covariance of the asset in question while the denominator is the variance of the market. These complicated-sounding variables aren’t actually that difficult to compute.
Here’s an example of the data you’ll need to calculate Beta:
Risk-free rate (typically Treasuries at least two years out)
Your asset’s rate of return over some period (typically one year to five years)
Your benchmark’s rate of return over the same period as the asset
To show how to use these variables to do the calculation of Beta, we’ll assume a risk-free rate of 2%, our stock’s rate of return of 14% and the benchmark’s rate of return of 8%.
You start by subtracting the risk-free rate of return from both the security in question and the benchmark. In this case, our asset’s rate of return net of the risk-free rate would be 12% (14% – 2%). The same calculation for the benchmark would yield 6% (8% – 2%).
These two numbers – 12% and 6%, respectively – are the numerator and denominator for the Beta formula. Twelve divided by six yields a value of 2.00, and that is the Beta for this hypothetical security.
On average, we’d expect an asset with this Beta value to be 200% as volatile as the benchmark.
Thinking about it another way, this asset should be about twice as volatile as the benchmark while still having its expected returns correlated in the same direction.
That is, returns would be correlated with the market’s overall direction, but would return double what the market did during the period.
This would be an example of a very high Beta stock and would offer a significantly higher risk profile than an average or low Beta stock.
Beta & The Capital Asset Pricing Model
The Capital Asset Pricing Model, or CAPM, is a common investing formula that utilizes the Beta calculation to account for the time value of money as well as the risk-adjusted returns expected for a particular asset.
Beta is an essential component of the CAPM because without it, riskier securities would appear more favorable to prospective investors. Their risk wouldn’t be accounted for in the calculation.
The CAPM formula is as follows:

The variables are defined as:
ERi = Expected return of investment
Rf = Risk-free rate
βi = Beta of the investment
ERm = Expected return of market
The risk-free rate is the same as in the Beta formula, while the Beta that you’ve already calculated is simply placed into the CAPM formula.
The expected return of the market (or benchmark) is placed into the parentheses with the market risk premium, which is also from the Beta formula. This is the expected benchmark’s return minus the risk-free rate.
To continue our example, here is how the CAPM actually works:
ER = 2% + 2.00(8% – 2%)
In this case, our security has an expected return of 14% against an expected benchmark return of 8%. In theory, this security should vastly outperform the market to the upside but keep in mind that during downturns, the security would suffer significantly larger losses than the benchmark.
If we changed the expected return of the market to -8% instead of +8%, the same equation yields expected returns for our hypothetical security of -18%.
This security would theoretically achieve stronger returns to the upside but certainly much larger losses on the downside, highlighting the risk of high Beta names during anything but strong bull markets.
While the CAPM certainly isn’t perfect, it is relatively easy to calculate and gives investors a means of comparison between two investment alternatives.
Analysis On The 5 Highest-Beta Dividend Stocks
Now, we’ll take a look at the 5 dividend stocks with the highest Beta scores (in ascending order from lowest to highest) in the Sure Analysis Research Database:
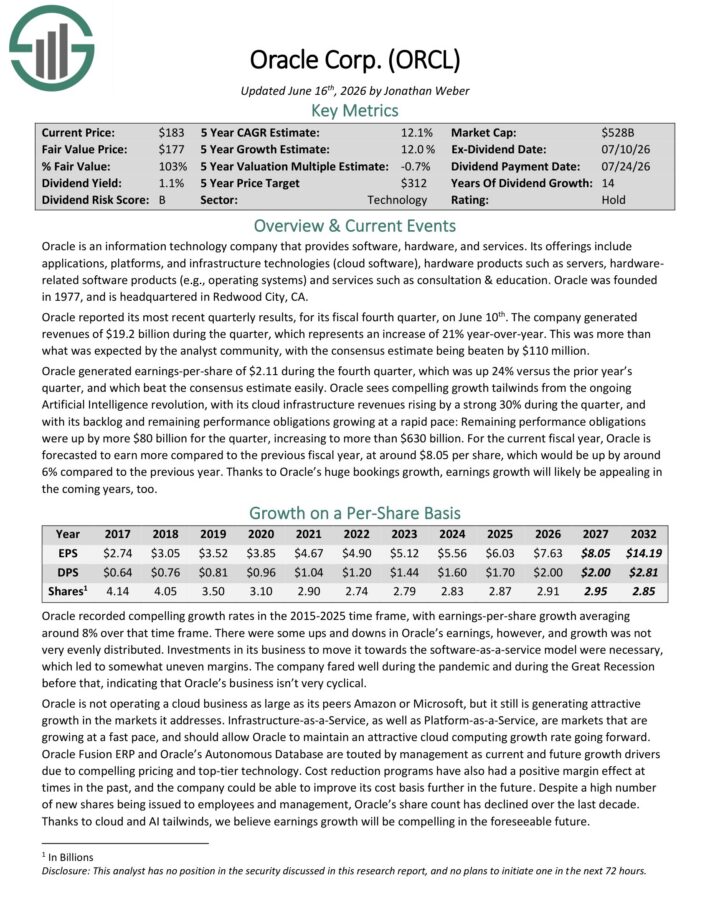
#5: Oracle Corp. (ORCL)
Oracle is an information technology company that provides software, hardware, and services.
Its offerings include applications, platforms, and infrastructure technologies (cloud software), hardware products such as servers, hardware related software products (e.g., operating systems) and services such as consultation & education.
Oracle reported its most recent quarterly results, for its fiscal fourth quarter, on June 10th. The company generated revenues of $19.2 billion during the quarter, which represents an increase of 21% year-over-year.
This was more than what was expected by the analyst community, with the consensus estimate being beaten by $110 million.
Oracle generated earnings-per-share of $2.11 during the fourth quarter, which was up 24% versus the prior year’s quarter, and which beat the consensus estimate easily.
Oracle sees compelling growth tailwinds from the ongoing Artificial Intelligence revolution, with its cloud infrastructure revenues rising by a strong 30% during the quarter, and with its backlog and remaining performance obligations growing at a rapid pace.
Click here to download our most recent Sure Analysis report on ORCL (preview of page 1 of 3 shown below):
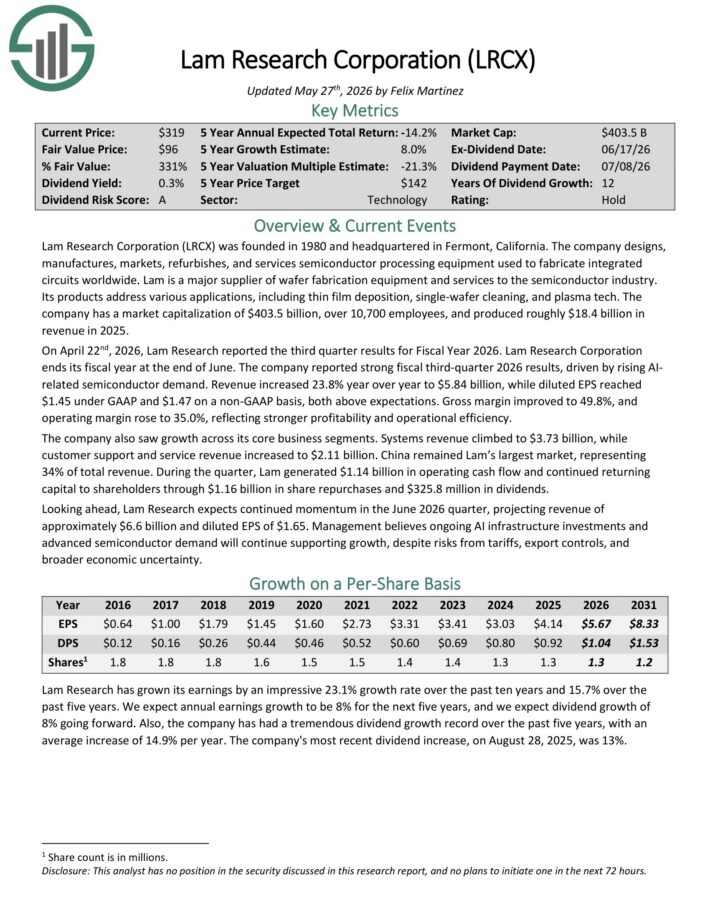
#4: Lam Research Corp. (LRCX)
Lam Research Corporation designs, manufactures, markets, refurbishes, and services semiconductor processing equipment used to fabricate integrated circuits worldwide.
Lam is a major supplier of wafer fabrication equipment and services to the semiconductor industry. Its products address various applications, including thin film deposition, single-wafer cleaning, and plasma tech.
On April 22nd, 2026, Lam Research reported the third quarter results for Fiscal Year 2026. Lam Research Corporation ends its fiscal year at the end of June.
The company reported strong fiscal third-quarter 2026 results, driven by rising AI-related semiconductor demand. Revenue increased 23.8% year over year to $5.84 billion, while diluted EPS reached $1.45 under GAAP and $1.47 on a non-GAAP basis, both above expectations.
Gross margin improved to 49.8%, and operating margin rose to 35.0%, reflecting stronger profitability and operational efficiency.
Click here to download our most recent Sure Analysis report on LRCX (preview of page 1 of 3 shown below):
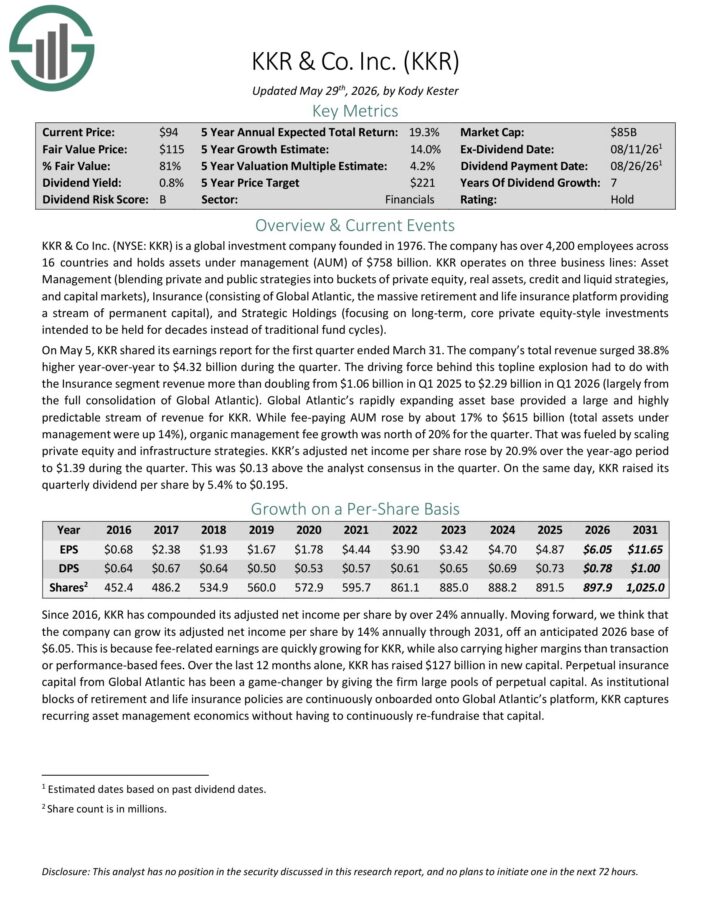
#3: KKR & Co. (KKR)
KKR & Co Inc. (NYSE: KKR) is a global investment company founded in 1976. The company has over 4,200 employees across 16 countries and holds assets under management (AUM) of $758 billion.
KKR operates on three business lines: Asset Management (blending private and public strategies into buckets of private equity, real assets, credit and liquid strategies, and capital markets), Insurance (consisting of Global Atlantic, the massive retirement and life insurance platform providing a stream of permanent capital), and Strategic Holdings (focusing on long-term, core private equity-style investments intended to be held for decades instead of traditional fund cycles).
On May 5, KKR shared its earnings report for the first quarter ended March 31. The company’s total revenue surged 38.8% higher year-over-year to $4.32 billion during the quarter.
The driving force behind this top-line explosion had to do with the Insurance segment revenue more than doubling from $1.06 billion in Q1 2025 to $2.29 billion in Q1 2026 (largely from the full consolidation of Global Atlantic).
Global Atlantic’s rapidly expanding asset base provided a large and highly predictable stream of revenue for KKR.
KKR’s adjusted net income per share rose by 20.9% over the year-ago period to $1.39 during the quarter. This was $0.13 above the analyst consensus in the quarter.
On the same day, KKR raised its quarterly dividend per share by 5.4% to $0.195.
Click here to download our most recent Sure Analysis report on KKR (preview of page 1 of 3 shown below):
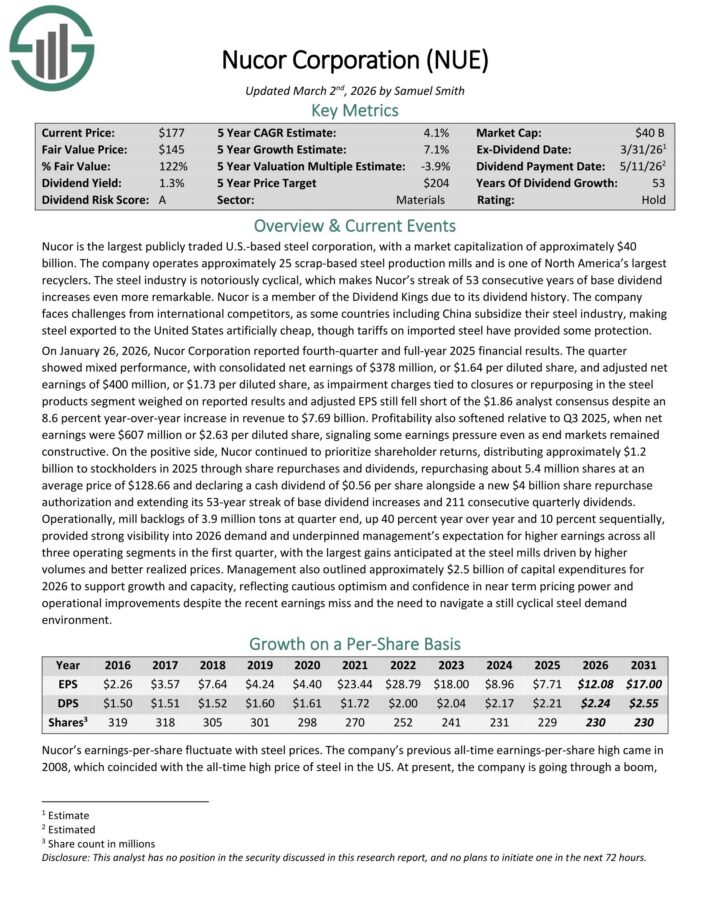
#2: Nucor Corp. (NUE)
Nucor is the largest publicly traded U.S.-based steel corporation. The company operates approximately 25 scrap-based steel production mills and is one of North America’s largest recyclers.
On January 26, 2026, Nucor Corporation reported fourth-quarter and full-year 2025 financial results. The quarter showed mixed performance, with consolidated net earnings of $378 million, or $1.64 per diluted share, and adjusted net earnings of $400 million, or $1.73 per diluted share.
Impairment charges tied to closures or repurposing in the steel products segment weighed on reported results and adjusted EPS fell short of the $1.86 analyst consensus, despite an 8.6 percent year-over-year increase in revenue to $7.69 billion.
Profitability also softened relative to Q3 2025, when net earnings were $607 million or $2.63 per diluted share, signaling some earnings pressure even as end markets remained constructive.
Nucor continued to prioritize shareholder returns, distributing approximately $1.2 billion to stockholders in 2025 through share repurchases and dividends, repurchasing about 5.4 million shares at an average price of $128.66.
The company also declared a cash dividend of $0.56 per share alongside a new $4 billion share repurchase authorization and extended its 53-year streak of base dividend increases and 211 consecutive quarterly dividends.
Click here to download our most recent Sure Analysis report on NUE (preview of page 1 of 3 shown below):
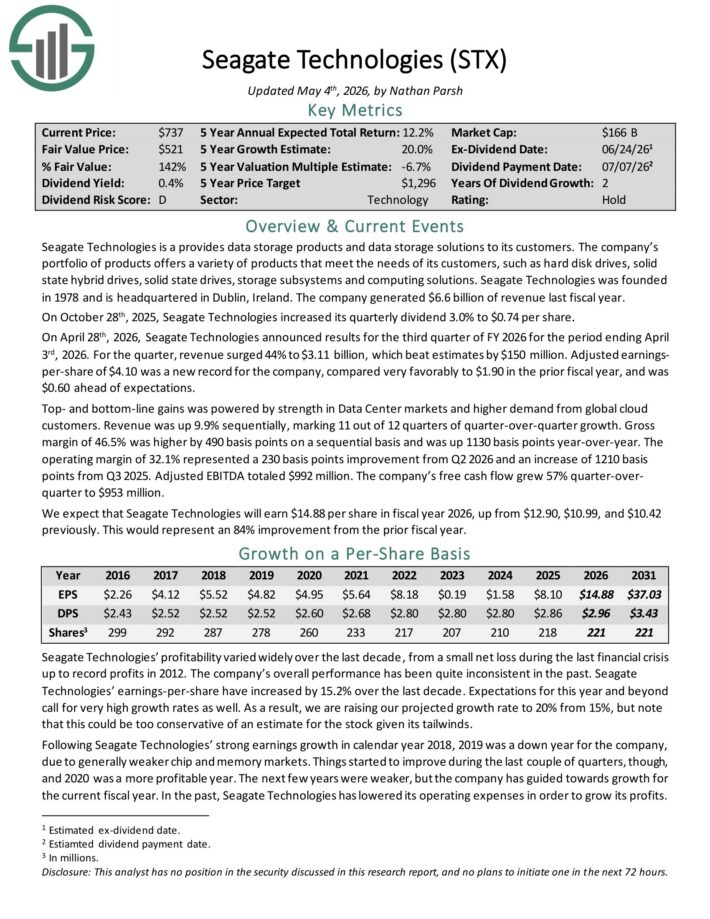
#1: Seagate Technologies (STX)
Seagate Technologies provides data storage products and data storage solutions.
The company’s portfolio of products offers a variety of products that meet the needs of its customers, such as hard disk drives, solid state hybrid drives, solid state drives, storage subsystems and computing solutions.
On April 28th, 2026, Seagate Technologies announced results for the third quarter of FY 2026 for the period ending April 3rd, 2026. For the quarter, revenue surged 44% to $3.11 billion, which beat estimates by $150 million.
Adjusted earnings-per-share of $4.10 was a new record for the company, compared very favorably to $1.90 in the prior fiscal year, and was $0.60 ahead of expectations.
Top- and bottom-line gains was powered by strength in Data Center markets and higher demand from global cloud customers. Revenue was up 9.9% sequentially, marking 11 out of 12 quarters of quarter-over-quarter growth.
Gross margin of 46.5% was higher by 490 basis points on a sequential basis and was up 1130 basis points year-over-year.
The operating margin of 32.1% represented a 230 basis points improvement from Q2 2026 and an increase of 1210 basis points from Q3 2025.
Adjusted EBITDA totaled $992 million. The company’s free cash flow grew 57% quarter-over-quarter to $953 million.
Click here to download our most recent Sure Analysis report on STX (preview of page 1 of 3 shown below):
Final Thoughts
Investors must take risk into account when selecting prospective investments. After all, if two securities are otherwise similar in terms of expected returns but one offers a much lower Beta, the investor would do well to select the low Beta security as it would offer better risk-adjusted returns.
Using Beta can help investors determine which securities will produce more volatility than the broader market, such as the ones listed here.
The five stocks we’ve looked at offer investors high Beta scores along with very strong prospective returns.
For investors who want to take some additional risk in their portfolio, these names and others like them in our list of the 100 best high Beta stocks can help determine what to look for when selecting a high Beta stock to buy.
At Sure Dividend, we often advocate for investing in companies with a high probability of increasing their dividends each and every year.
If that strategy appeals to you, it may be useful to browse through the following databases of dividend growth stocks:
The Dividend Aristocrats List: S&P 500 dividend stocks with 25+ years of consecutive dividend increases
The Dividend Kings List is even more exclusive than the Dividend Aristocrats. It is comprised of 58 stocks with 50+ years of consecutive dividend increases.
The High Yield Dividend Kings List is comprised of the 20 Dividend Kings with the highest current yields.
The Blue Chip Stocks List: stocks that qualify as Dividend Achievers, Dividend Aristocrats, and/or Dividend Kings
The High Dividend Stocks List: stocks that appeal to investors interested in the highest yields of 5% or more.
The Monthly Dividend Stocks List: stocks that pay dividends every month, for 12 dividend payments per year.
The Dividend Champions List: stocks that have increased their dividends for 25+ consecutive years.Note: Not all Dividend Champions are Dividend Aristocrats because Dividend Aristocrats have additional requirements like being in The S&P 500.
Thanks for reading this article. Please send any feedback, corrections, or questions to [email protected].


")
")
")


")


