
Published on May 18th, 2026 by Bob Ciura
Investing has traditionally been broadly categorized into “growth”, and “value” styles.
Value investors look for stocks trading for less than they are worth.
Growth investors look for fast-growing stocks that will be worth more in the future.
Both value and growth are important. Valuation matters. And so does future growth potential. The synthesis of growth investing and value investing is GARP investing.
GARP stands for “Growth At A Reasonable Price”.
It aims to buy fast growing companies trading at reasonable prices. The key metric for GARP investors is the PEG ratio.
The PEG ratio takes the P/E ratio and divides it by the expected annualized growth rate x 100.
Example: A stock growing at 10% annually with a P/E ratio of 20 would have a PEG ratio of 2.0.
GARP investors ideally want securities trading for PEG ratios of 1.0 or less. These are rare, especially in today’s high P/E ratio market.
That’s because stocks with strong growth prospects tend to not have low P/E ratios. If expected growth is strong, sentiment is usually not negative.
What the PEG ratio does not take into account is dividends. Dividends matter to investing – and especially to dividend growth investors.
Blue-chip stocks are well-established, financially strong, and consistently profitable companies.
This research report has the following resources to help you invest in blue chip stocks:

We look for high quality fast-growing dividend stocks trading at or below fair value to buy and hold for the long run.
This lines up well with the PEG ratio, especially compared to the broader market.
This article will list the 10 lowest PEG ratio stocks in the S&P 500, that we cover in the Sure Analysis Research Database.
They are ranked in order of PEG ratio, from lowest to highest.
Table of Contents
The table of contents below allows for easy navigation. PEG ratio data provided by ycharts.
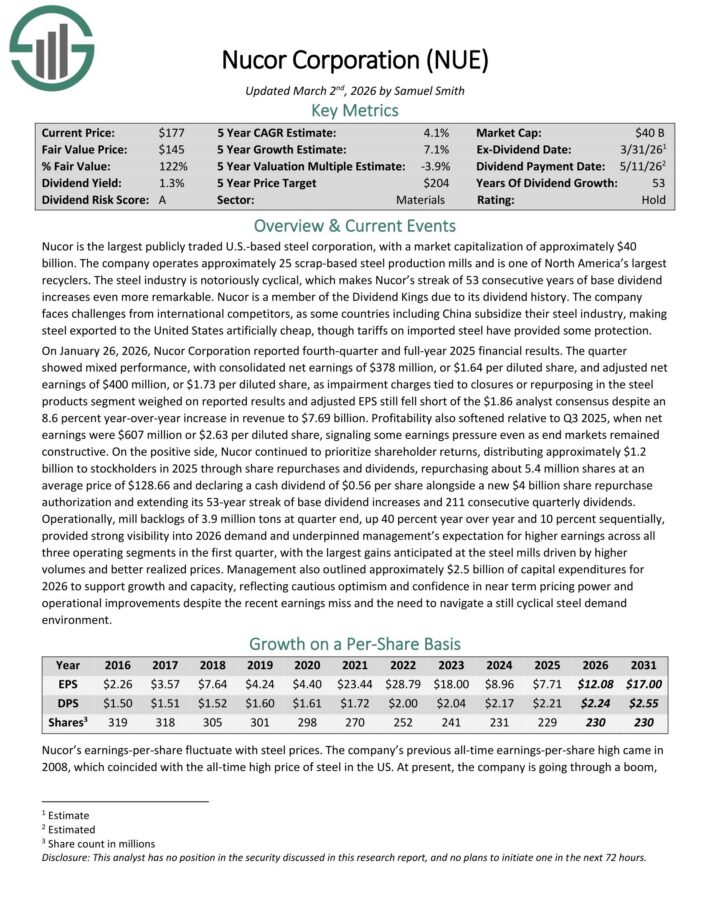
Low PEG Ratio Stock #10: Nucor Corporation (NUE)
Nucor is the largest publicly traded U.S.-based steel corporation. The company operates approximately 25 scrap-based steel production mills and is one of North America’s largest recyclers.
On January 26, 2026, Nucor Corporation reported fourth-quarter and full-year 2025 financial results. The quarter showed mixed performance, with consolidated net earnings of $378 million, or $1.64 per diluted share, and adjusted net earnings of $400 million, or $1.73 per diluted share.
Impairment charges tied to closures or repurposing in the steel products segment weighed on reported results and adjusted EPS fell short of the $1.86 analyst consensus, despite an 8.6 percent year-over-year increase in revenue to $7.69 billion.
Profitability also softened relative to Q3 2025, when net earnings were $607 million or $2.63 per diluted share, signaling some earnings pressure even as end markets remained constructive.
Nucor continued to prioritize shareholder returns, distributing approximately $1.2 billion to stockholders in 2025 through share repurchases and dividends, repurchasing about 5.4 million shares at an average price of $128.66.
The company also declared a cash dividend of $0.56 per share alongside a new $4 billion share repurchase authorization and extended its 53-year streak of base dividend increases and 211 consecutive quarterly dividends.
Click here to download our most recent Sure Analysis report on NUE (preview of page 1 of 3 shown below):
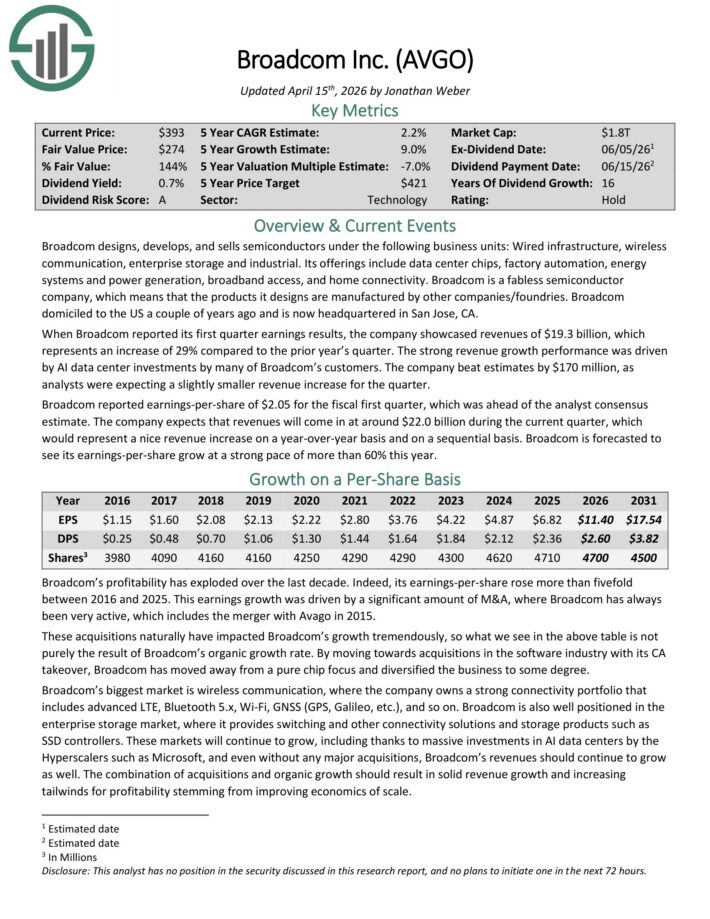
Low PEG Ratio Stock #9: Broadcom Technology (AVGO)
Broadcom designs, develops, and sells semiconductors under the following business units: Wired infrastructure, wireless communication, enterprise storage and industrial.
Its offerings include data center chips, factory automation, energy systems and power generation, broadband access, and home connectivity.
Broadcom is a fabless semiconductor company, which means that the products it designs are manufactured by other companies/foundries.
When Broadcom reported its first quarter earnings results, the company showcased revenue of $19.3 billion, whichrepresented an increase of 29% compared to the prior year’s quarter.
The strong revenue growth performance was driven by AI data center investments by many of Broadcom’s customers. The company beat estimates by $170 million, as analysts were expecting a slightly smaller revenue increase for the quarter.
Broadcom reported earnings-per-share of $2.05 for the fiscal first quarter, which was ahead of the analyst consensus estimate.
The company expects that revenues will come in at around $22.0 billion during the current quarter, which would represent a nice revenue increase on a year-over-year basis and on a sequential basis.
Broadcom is forecasted to see its earnings-per-share grow at a strong pace of more than 60% this year..
Click here to download our most recent Sure Analysis report on AVGO (preview of page 1 of 3 shown below):
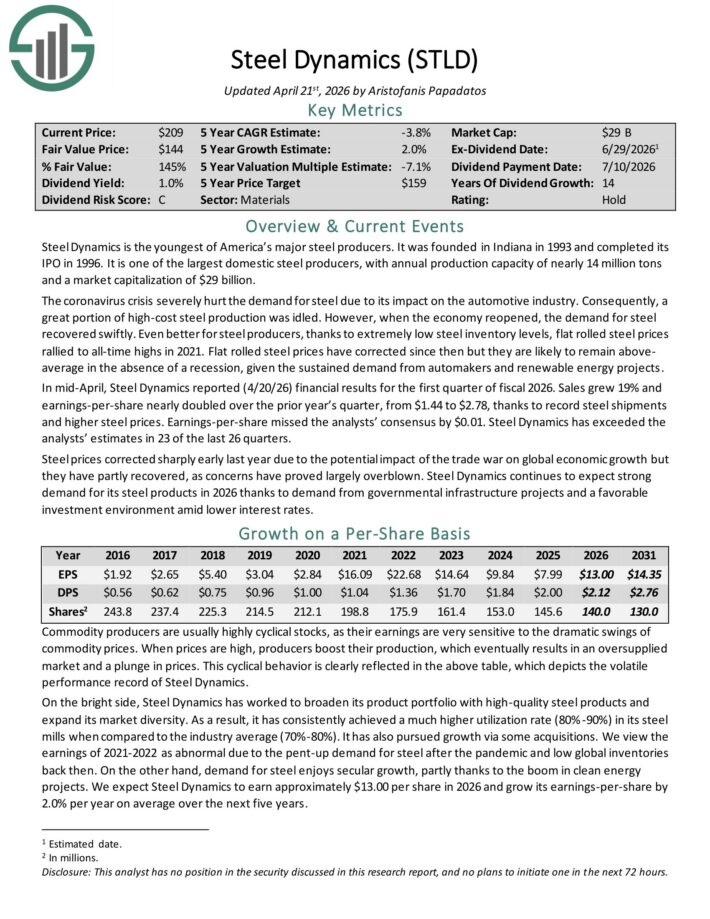
Low PEG Ratio Stock #8: Steel Dynamics (STLD)
Steel Dynamics is the youngest of America’s major steel producers. It was founded in Indiana in 1993 and completed its IPO in 1996.
It is one of the largest domestic steel producers, with annual production capacity of nearly 14 million tons.
In mid-April, Steel Dynamics reported (4/20/26) financial results for the first quarter of fiscal 2026. Sales grew 19% and earnings-per-share nearly doubled over the prior year’s quarter, from $1.44 to $2.78, thanks to record steel shipments and higher steel prices.
Earnings-per-share missed the analysts’ consensus by $0.01. Steel Dynamics has exceeded the analysts’ estimates in 23 of the last 26 quarters.
Click here to download our most recent Sure Analysis report on STLD (preview of page 1 of 3 shown below):
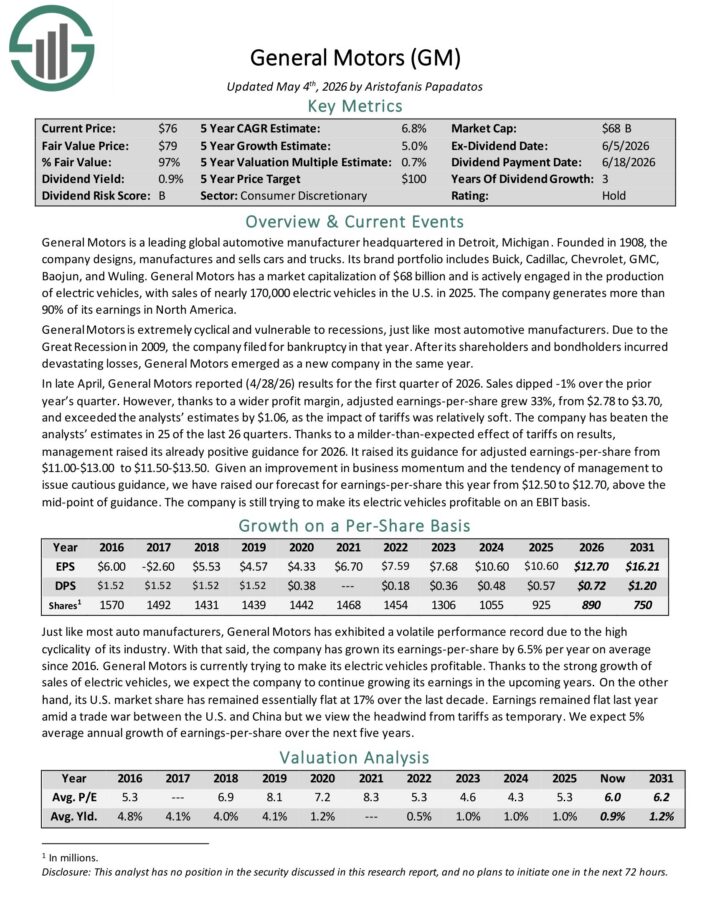
Low PEG Ratio Stock #7: General Motors (GM)
General Motors is a leading global automotive manufacturer headquartered in Detroit, Michigan.
Founded in 1908, the company designs, manufactures and sells cars and trucks. Its brand portfolio includes Buick, Cadillac, Chevrolet, GMC, Baojun, and Wuling.
The company generates more than 90% of its earnings in North America.
In late April, General Motors reported (4/28/26) results for the first quarter of 2026. Sales dipped -1% over the prior year’s quarter. However, thanks to a wider profit margin, adjusted earnings-per-share grew 33%, from $2.78 to $3.70, and exceeded the analysts’ estimates by $1.06, as the impact of tariffs was relatively soft.
The company has beaten the analysts’ estimates in 25 of the last 26 quarters. Thanks to a milder-than-expected effect of tariffs on results, management raised its already positive guidance for 2026.
It raised its guidance for adjusted earnings-per-share from $11.00-$13.00 to $11.50-$13.50.
Click here to download our most recent Sure Analysis report on GM (preview of page 1 of 3 shown below):
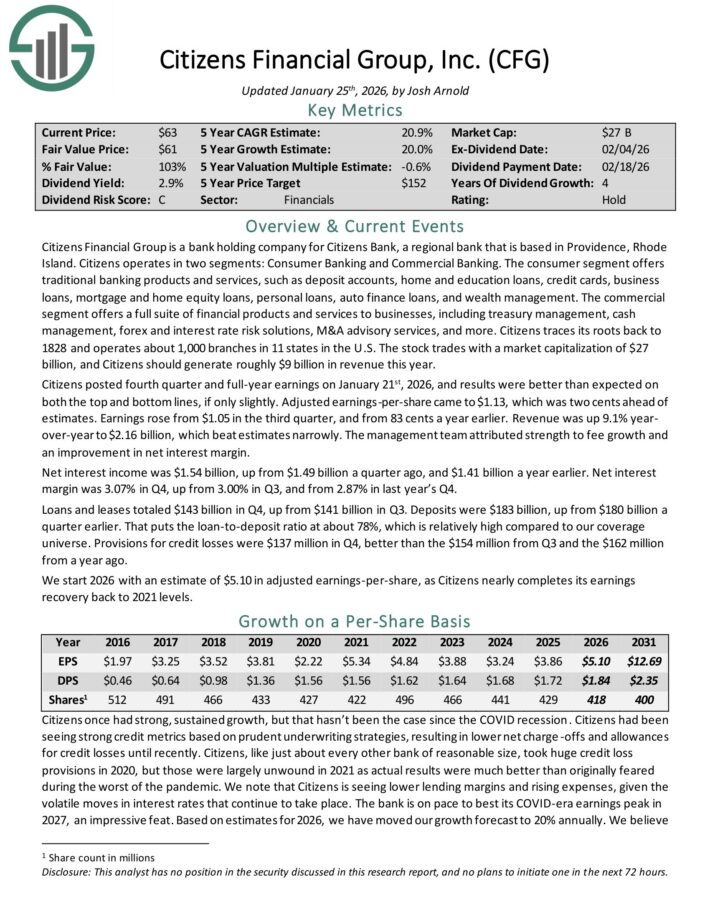
Low PEG Ratio Stock #6: Citizens Financial Group (CFG)
Citizens Financial Group is a bank holding company for Citizens Bank, a regional bank that is based in Providence, Rhode Island.
Citizens operates in two segments: Consumer Banking and Commercial Banking. The consumer segment offers traditional banking products and services.
The commercial segment offers a full suite of financial products and services to businesses, including treasury management, cash management, forex and interest rate risk solutions, M&A advisory services, and more.
Citizens traces its roots back to 1828 and operates about 1,000 branches in 11 states in the U.S. Citizens should generate roughly $9 billion in revenue this year.
Citizens posted fourth quarter and full-year earnings on January 21st, 2026, and results were better than expected on both the top and bottom lines, if only slightly.
Adjusted earnings-per-share came to $1.13, which was two cents ahead of estimates. Earnings rose from $1.05 in the third quarter, and from 83 cents a year earlier.
Revenue was up 9.1% year-over-year to $2.16 billion, which beat estimates narrowly. Net interest income was $1.54 billion, up from $1.49 billion a quarter ago, and $1.41 billion a year earlier.
We start 2026 with an estimate of $5.10 in adjusted earnings-per-share.
Click here to download our most recent Sure Analysis report on CFG (preview of page 1 of 3 shown below):
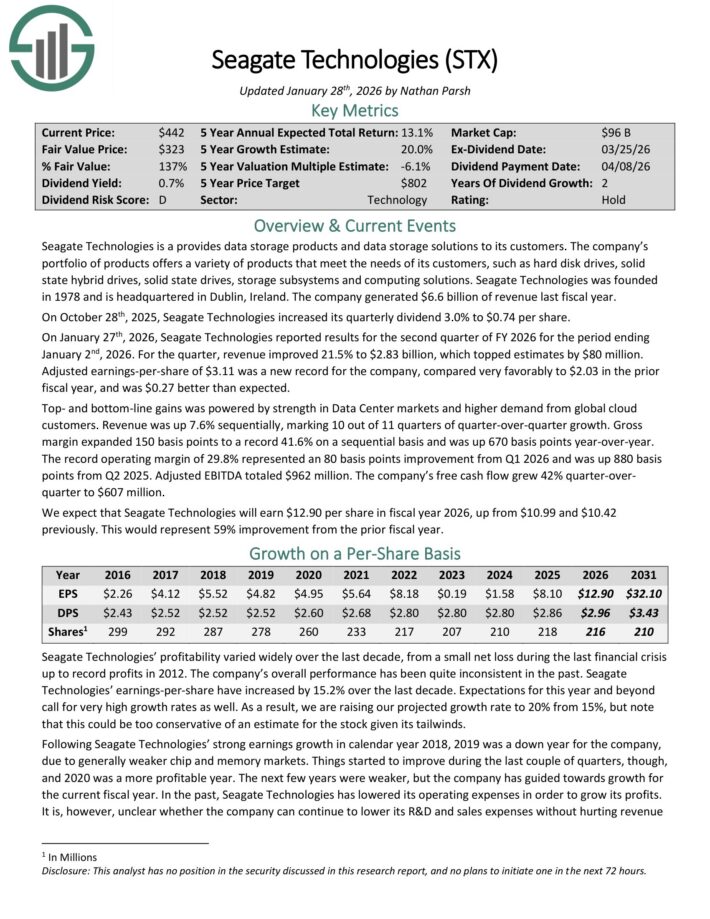
Low PEG Ratio Stock #5: Seagate Technologies (STX)
Seagate Technologies provides data storage products and data storage solutions.
The company’s portfolio of products offers a variety of products that meet the needs of its customers, such as hard disk drives, solid state hybrid drives, solid state drives, storage subsystems and computing solutions.
On January 27th, 2026, Seagate Technologies reported results for the second quarter of FY 2026 for the period ending January 2nd, 2026. For the quarter, revenue improved 21.5% to $2.83 billion, which topped estimates by $80 million.
Adjusted earnings-per-share of $3.11 was a new record for the company, compared very favorably to $2.03 in the prior fiscal year, and was $0.27 better than expected.
Top- and bottom-line gains was powered by strength in Data Center markets and higher demand from global cloud customers.
Revenue was up 7.6% sequentially, marking 10 out of 11 quarters of quarter-over-quarter growth. Gross margin expanded 150 basis points to a record 41.6% on a sequential basis and was up 670 basis points year-over-year.
The record operating margin of 29.8% represented an 80 basis points improvement from Q1 2026 and was up 880 basis points from Q2 2025.
Adjusted EBITDA totaled $962 million. The company’s free cash flow grew 42% quarter-over quarter to $607 million.
We expect that Seagate Technologies will earn $12.90 per share in fiscal year 2026.
Click here to download our most recent Sure Analysis report on STX (preview of page 1 of 3 shown below):
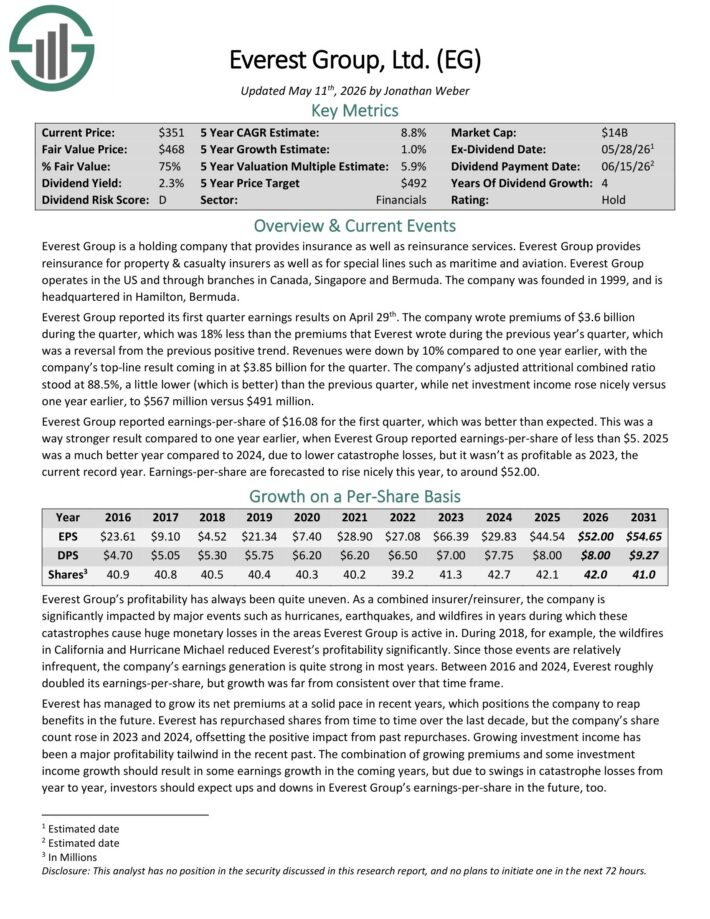
Low PEG Ratio Stock #4: Everest Group, Ltd. (EG)
Everest Group is a holding company that provides insurance as well as reinsurance services. Everest Group provides reinsurance for property & casualty insurers as well as for special lines such as maritime and aviation.
Everest Group operates in the US and through branches in Canada, Singapore and Bermuda. The company was founded in 1999, and is headquartered in Hamilton, Bermuda.
Everest Group reported its first quarter earnings results on April 29th. The company wrote premiums of $3.6 billion during the quarter, down 18% year-over-year.
Revenue was down by 10% compared to one year earlier, with the company’s top-line result coming in at $3.85 billion for the quarter.
The company’s adjusted attritional combined ratio stood at 88.5%, a little lower (which is better) than the previous quarter, while net investment income rose nicely versus one year earlier, to $567 million versus $491 million.
Everest Group reported earnings-per-share of $16.08 for the first quarter, which was better than expected.
Click here to download our most recent Sure Analysis report on EG (preview of page 1 of 3 shown below):
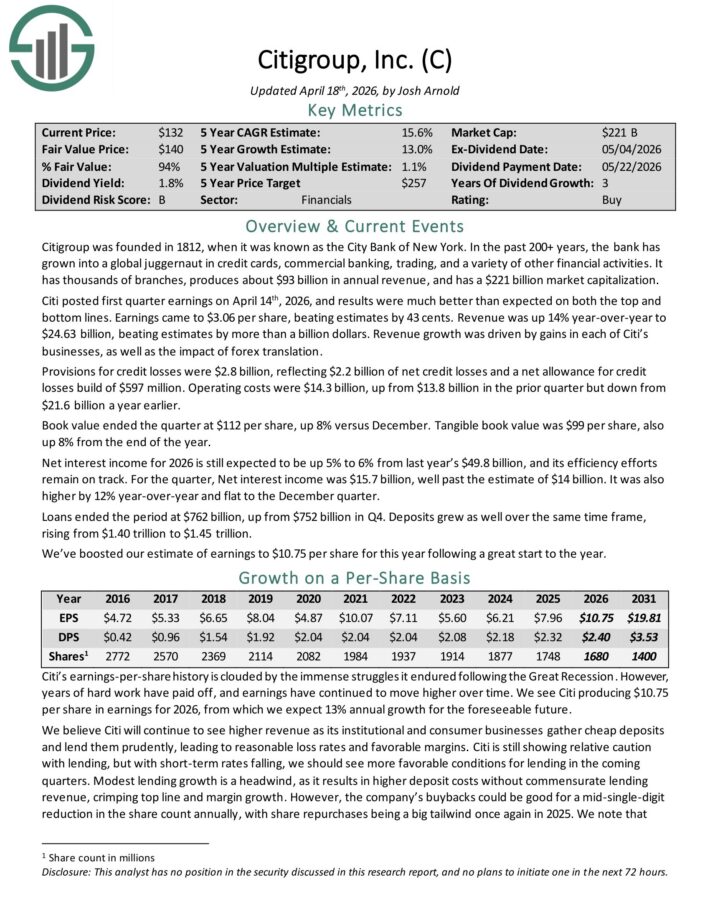
Low PEG Ratio Stock #3: Citigroup (C)
Citigroup was founded in 1812, when it was known as the City Bank of New York. In the past 200+ years, the bank has grown into a global juggernaut in credit cards, commercial banking, trading, and a variety of other financial activities.
Citi posted first quarter earnings on April 14th, 2026, and results were much better than expected on both the top and bottom lines. Earnings came to $3.06 per share, beating estimates by 43 cents.
Revenue was up 14% year-over-year to $24.63 billion, beating estimates by more than a billion dollars. Revenue growth was driven by gains in each of Citi’s businesses, as well as the impact of forex translation.
Provisions for credit losses were $2.8 billion, reflecting $2.2 billion of net credit losses and a net allowance for credit losses build of $597 million. Operating costs were $14.3 billion, up from $13.8 billion in the prior quarter but down from $21.6 billion a year earlier.
Book value ended the quarter at $112 per share, up 8% versus December. Tangible book value was $99 per share, also up 8% from the end of the year.
Net interest income for 2026 is still expected to be up 5% to 6% from last year’s $49.8 billion, and its efficiency efforts remain on track.
For the quarter, Net interest income was $15.7 billion, well past the estimate of $14 billion. It was also higher by 12% year-over-year and flat to the December quarter.
Loans ended the period at $762 billion, up from $752 billion in Q4. Deposits grew as well over the same time frame, rising from $1.40 trillion to $1.45 trillion.
Click here to download our most recent Sure Analysis report on C (preview of page 1 of 3 shown below):
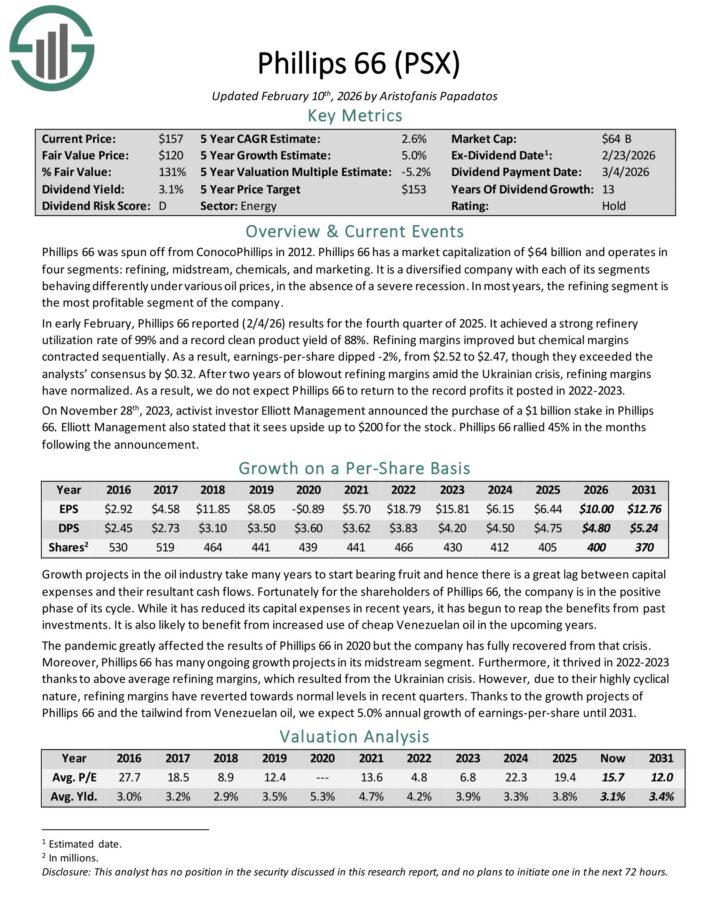
Low PEG Ratio Stock #2: Phillips 66 (PSX)
Phillips 66 was spun off from ConocoPhillips in 2012. Phillips 66 operates in four segments: refining, midstream, chemicals, and marketing.
It is a diversified company with each of its segments behaving differently under various oil prices, in the absence of a severe recession. In most years, the refining segment is the most profitable segment of the company.
In early February, Phillips 66 reported (2/4/26) results for the fourth quarter of 2025. It achieved a strong refinery utilization rate of 99% and a record clean product yield of 88%.
Refining margins improved but chemical margins contracted sequentially. As a result, earnings-per-share dipped -2%, from $2.52 to $2.47, though they exceeded the analysts’ consensus by $0.32.
After two years of blowout refining margins amid the Ukrainian crisis, refining margins have normalized.
The company is in the positive phase of its cycle. While it has reduced its capital expenses in recent years, it has begun to reap the benefits from past investments.
Click here to download our most recent Sure Analysis report on PSX (preview of page 1 of 3 shown below):
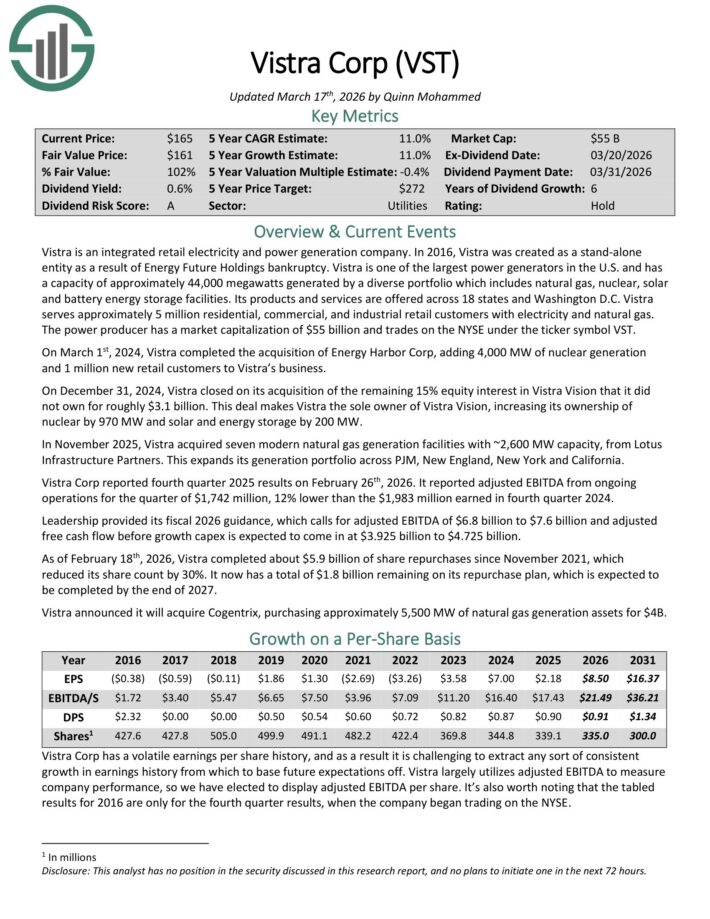
Low PEG Ratio Stock #1: Vistra Corp. (VST)
Vistra is an integrated retail electricity and power generation company.
It is one of the largest power generators in the U.S. and has a capacity of approximately 44,000 megawatts generated by a diverse portfolio which includes natural gas, nuclear, solar and battery energy storage facilities.
Its products and services are offered across 18 states and Washington D.C. Vistra serves approximately 5 million residential, commercial, and industrial retail customers with electricity and natural gas.
Vistra Corp reported fourth quarter 2025 results on February 26th, 2026. It reported adjusted EBITDA from ongoingoperations for the quarter of $1,742 million, 12% lower than the $1,983 million earned in fourth quarter 2024.
Leadership provided its fiscal 2026 guidance, which calls for adjusted EBITDA of $6.8 billion to $7.6 billion and adjusted free cash flow before growth capex is expected to come in at $3.925 billion to $4.725 billion.
Click here to download our most recent Sure Analysis report on VST (preview of page 1 of 3 shown below):
Other Blue Chip Stock Resources
The resources below will give you a better understanding of dividend growth investing:
Thanks for reading this article. Please send any feedback, corrections, or questions to [email protected].
")


")


 Foe Is Needed: “Left-Wing Political Terrorism”")


")


