If you want stock analysis without living inside spreadsheets, this simplywall.st review will help you decide whether the platform deserves a place in your research workflow. Simply Wall St turns dense financial statements into charts, gauges, and visual summaries, making it especially useful for long term investing, value investing, and portfolio monitoring.
Quick Verdict: Is Simply Wall St Worth It?
Yes, simply wall st is worth it for visual, long-term investors who want a quick overview of a company’s fundamentals, valuation, and portfolio risk. It is not built for day traders, options scalpers, or deep quants who need real-time feeds and professional grade tools.
Best for retail investors, visual learners, beginners, and intermediate stock pickers.
The free plan is useful for testing, while paid users get more value from company reports, alerts, and portfolio command center features.
The Premium plan costs $10.95 per month, and Simply Wall St’s Unlimited plan costs $21.50 per month.
The platform is strong in global coverage, portfolio tracking, past performance visuals, and valuation analysis.
The biggest drawbacks are limited customization, no real-time trading tools, and occasional user complaints about data updates and portfolio syncing.
Why I Wrote This Simply Wall St Review
I wrote this Simply Wall St review from the perspective of a retail investor testing the web platform and Simply Wall St app across 2024–2026. The goal is simple: answer “Is SimplyWall.St worth it?”, “What are Simply Wall St’s best features?”, “How much does it cost?”, and “Are there real discounts?”
This review is independent and not sponsored. Keep reading if you:
Want a one platform dashboard for stocks, watchlists, and an investment portfolio.
Prefer visual analysis over long reports.
Care about intrinsic value, fair value, earnings growth, and company health.
Want to sign up only after understanding the platform’s features and limits.
What Is Simply Wall St? (Simply Wall Street Explained)
Simply Wall St, sometimes searched as simply wall street, is a cloud-based stock research and portfolio tracking platform launched in Sydney, Australia in 2014. The platform distills dense financial statements into interactive infographics and converts data into digestible tables, charts, and gauges.
It uses a visual approach to stock analysis built around the Snowflake diagram.
Core tools include the portfolio command center, company reports, discovery tools, stock screener, watchlists, Narratives, and market analysis.
The platform provides comprehensive coverage of stocks across major international exchanges and a single destination to research mid-cap and small-cap international firms.
Simply Wall St covers roughly 120,000+ stocks across around 90 markets, according to its company overview.
Simply Wall St uses S&P Global data for its Snowflake analysis and financial data, including analyst estimates and historical data, as described in its data sourcing notes.
The software evaluates value, health, growth, and dividends for over 100,000 global stocks and ETFs, but the platform is limited to equities, excluding mutual funds and cryptocurrencies as primary research assets.
Simply Wall St’s Core Features
Simply wall st offers five main reasons to use the platform: snowflake analysis, company reports, portfolio tracking, discovery tools, and analyst insights. Each is designed to help investors analyze stocks faster.
Snowflake Analysis & Visual Stock Ratings
The Snowflake summarizes a stock’s profile across five dimensions. Each Snowflake axis represents value, growth, performance, health, and dividends. A larger, greener Snowflake indicates better fundamental checks passed.
For example, a 2025 Apple Snowflake might show strong past performance and company health, but weaker value because the pe ratio and valuation multiples are high.
Use it for:
Fast comparison of specific companies.
Spotting stock scores, risk areas, and fundamental checks.
Helping visual learners avoid exhausting financial reports.
Screening undervalued companies quickly.
Limitations:
Simply Wall St’s Snowflake analysis simplifies stock evaluation.
The Snowflake serves as a quick screening tool for investors, not a final decision.
All initial metrics are algorithmic and grounded in objective mathematical logic, so sector nuance can be missed.
Stock Unlock provides industry-specific scoring algorithms for better accuracy in some sectors.
Company Reports & Fundamental Breakdown
Company reports are the heart of the platform. They combine valuation analysis, automated DCF models, analyst ratings, past performance, dividends, ownership, management, and recent insider transactions.
Automated DCF valuation provides an estimated intrinsic share price based on consensus analyst data. That is useful, but automated DCF estimates can oversimplify complex businesses.
A good report usually includes:
Fair value and intrinsic value estimates.
Analyst price targets from professional analysts.
Analyst estimates for revenue and earnings growth.
Historical growth rates and historical averages.
Alerts for debt, dividend cuts, or insider buying and selling.
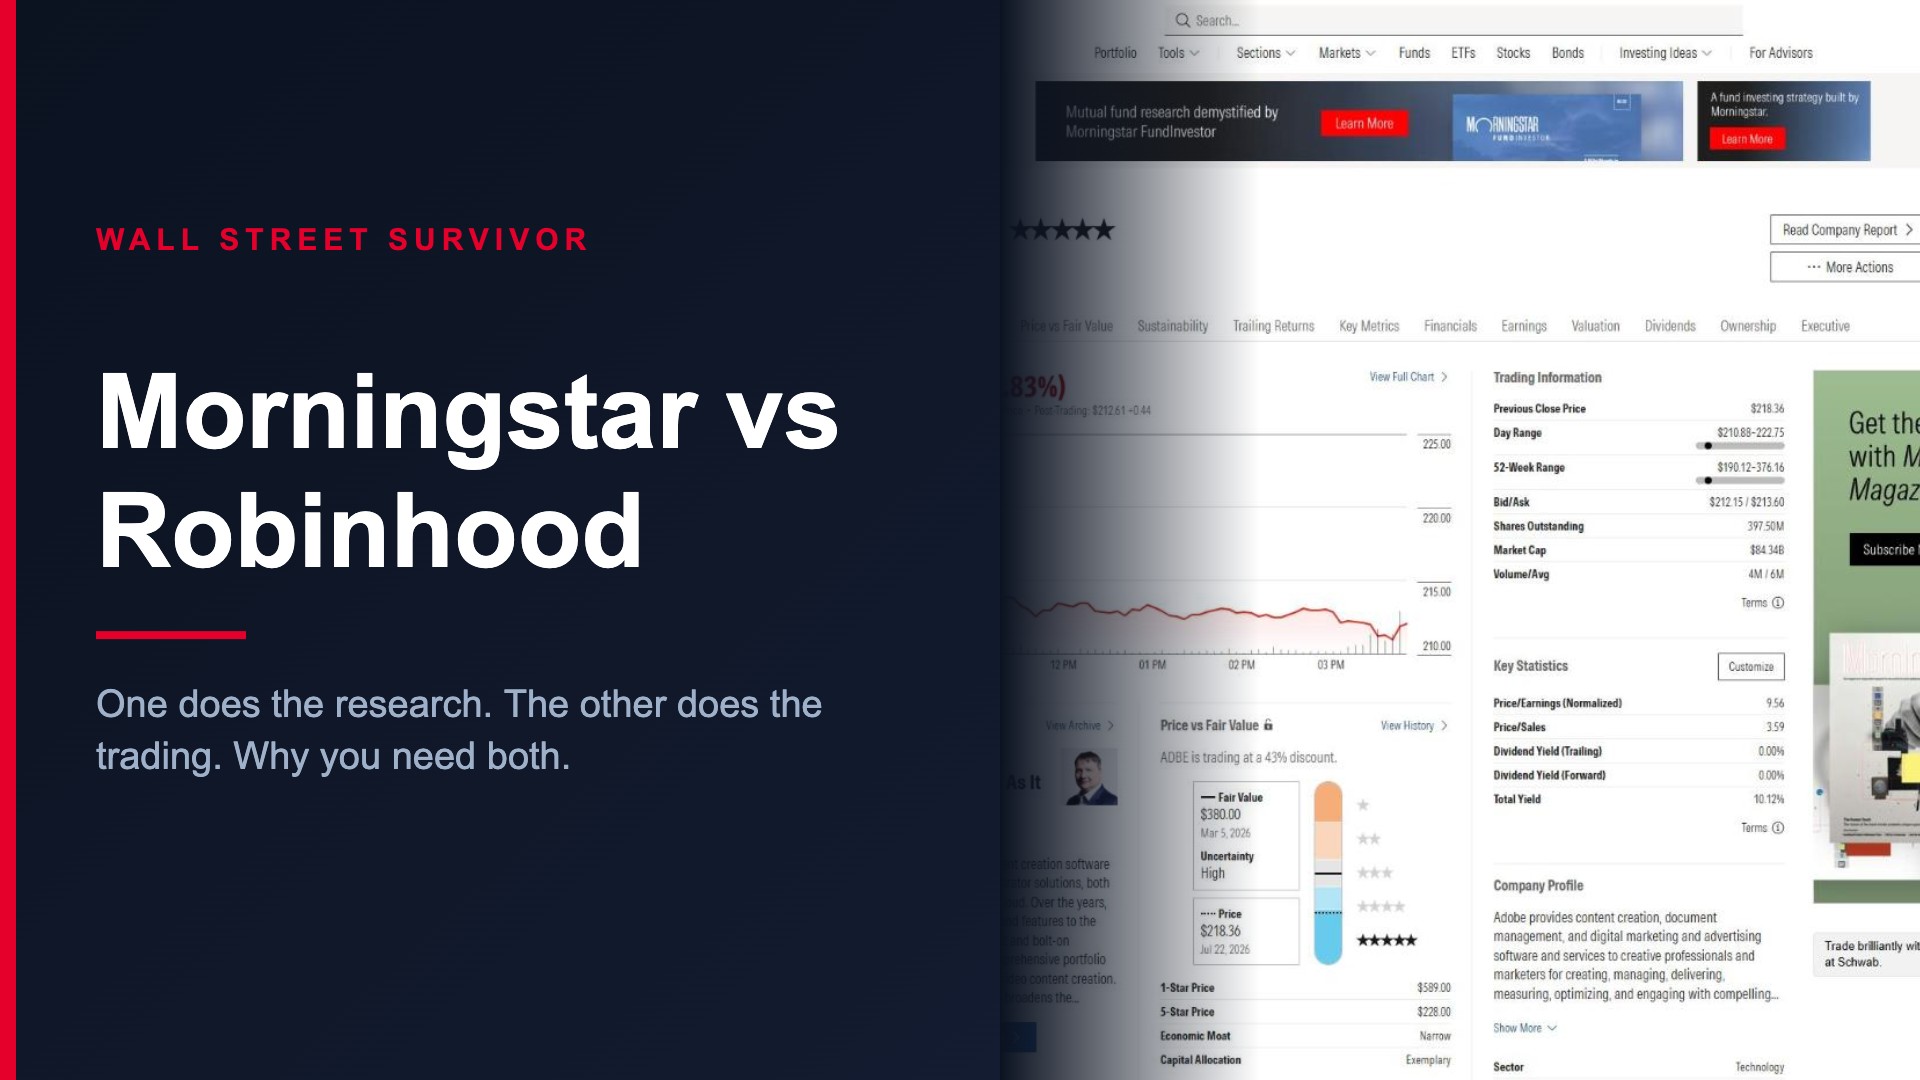
These reports save countless hours, but Morningstar is considered better for deep fundamental research than Simply Wall St, and Seeking Alpha offers more diverse analysis compared to Simply Wall St.
Portfolio Tracking & Portfolio Command Center
The Portfolio Command Center lets users track holdings, returns, dividends, and risk in one dashboard. Users can track multiple accounts and brokers with ease when broker sync is supported.
You can add holdings by:
Broker connection.
CSV upload.
Manual entry of stock holdings for portfolio tracking, including ticker, share count, and cost basis.
You can monitor:
Realized and unrealized gains.
Dividend income.
Sector and country exposure.
Portfolio snowflake scores.
Intrinsic value vs. current market price.
The main limits are no mutual funds, off-market securities, or cryptocurrencies, plus portfolio size caps by tier. Some users report issues with data updates and portfolio syncing.

Discovery Tools, Screeners & Investing Ideas
The discovery tools help investors move from passive tracking to idea generation. The platform allows investors to filter equities using grid screeners and find stocks by valuation, growth, dividend yield, market cap, sector, country, and Snowflake score.
Common uses include:
Finding dividend powerhouses.
Screening undervalued dividend stocks in the U.S. and Europe.
Searching for high insider ownership.
Building watchlists around quality, income, or growth.
Tracking candidate stocks with alerts.
The stock screener is fast and easy, but it is less flexible than institutional screeners with factor backtesting.
Narratives, Alerts & Analyst Insights
Narratives help investors write a clearer case for owning a company. They blend analyst insights, consensus forecasts, historical trends, and key risk notes into readable summaries.
Alerts can cover:
Earnings releases.
Dividend announcements.
Valuation changes vs. fair value.
Recent insider transactions.
News affecting portfolio or watchlist stocks.
Treat analyst insights as inputs, not guarantees. Successful investors still verify the analysis with filings, management commentary, and other reliable data.
Simply Wall St Pricing & Plans (2026)
Simply Wall St pricing has three main tiers: Free, Premium, and Unlimited. Plan details can change, so verify the latest fees on the official pricing page before subscribing.
Simply Wall St’s pricing is competitive compared to other platforms, especially for global stock coverage.
Free Plan: Testing Simply Wall St at No Cost
Simply Wall St offers a Free plan with limited features. Users can access five company reports per month on the Free plan.
The free tier usually includes:
One small portfolio.
One watchlist.
Five monthly company reports.
Limited screeners and alerts.
No full broker sync.
Stick with the free plan if you only want occasional checks. Upgrade if you quickly hit report limits or want more portfolio tracking.
Premium Plan: Mid-Tier Option
The Premium plan is priced at $10.95 per month, usually with better value on annual billing. It gives more reports, more portfolios, more watchlists, and broker sync where supported.
Premium makes sense if you:
Have a small but growing portfolio.
Read company reports every week.
Want more alerts and discovery tools.
Need broker syncing without jumping straight to Unlimited.
The drawback is that Premium can feel like a bridge tier. Some users either stay Free or upgrade directly to Unlimited.
Unlimited Plan: Full Access for Power Users
The unlimited plan is the full access tier. Simply Wall St’s Unlimited plan costs $21.50 per month and is aimed at investors who rely heavily on the platform.
It typically includes:
Up to five portfolios.
Far more company reports.
More saved screeners and alerts.
More watchlists.
Broker sync.
Priority support.
This tier fits experienced investors with multiple accounts, global watchlists, and larger portfolios. If a seasoned investor manages a five-figure or six-figure portfolio and uses the tools weekly, the fee can be justified.
Simply Wall St Discounts, Trials & Refunds
New users can sign up with email, password, and basic profile details. In some regions, a trial may be available with no credit card required, but confirm during checkout.
To get more value:
Watch for seasonal discounts, especially around Black Friday or New Year.
Check for first-year annual offers.
Look for retention discounts when canceling.
Set a renewal reminder before annual billing.
Contact the support team if a billing issue appears.
Auto-renewal has been a pain point in some reviews, so do not ignore confirmation emails.
Strengths: What Simply Wall St Does Well
Simply Wall St is popular because it makes financial metrics easier to understand. It helps investors make informed investment decisions without turning every stock review into a spreadsheet project.
Visual Design & Ease of Use
Simply Wall St is designed for visual learners and beginners. The platform is visually appealing and user-friendly for beginners because the Snowflake, color coding, and charts make research feel less intimidating.
Visual Simplicity helps eliminate the need to read exhausting financial reports, although serious research should still include source documents.
Portfolio Analysis & True Performance View
Portfolio analysis is one of the strongest parts of the platform. You can see time-based returns, realized gains, unrealized gains, dividends, country exposure, and sector concentration.
The portfolio snowflake combines your holdings into a visual representation of overall portfolio quality. This helps identify overconcentration and weaker holdings.
Global Coverage, Data Depth & Company Reports
The platform’s international reach is a major advantage. It is useful if you compare U.S. technology stocks, European industrials, Australian miners, or Asian consumer companies.
The financial data comes from reputable sources, and daily updates are generally enough for long-term investors. The platform provides comprehensive company reports without forcing users to read raw filings first.
Discovery Tools, Themes & Alerts
Discovery tools help turn data points into research ideas. You can screen by value, growth, dividends, ownership, and market region, then save candidates to a watchlist.
Alerts also help investors avoid missing earnings, dividend changes, valuation shifts, and insider activity.
Weaknesses & Limitations: Where Simply Wall St Falls Short
No platform is perfect. Simply Wall St is better for quick assessments than in-depth analysis, so use it as a starting point rather than your only research source.
Depth of Analysis vs. Professional Platforms
Simply Wall St prioritizes simplicity and automation. That means it lacks depth for experienced investors seeking detailed analysis.
Advanced users may dislike:
Limited DCF customization.
Generic models for banks, REITs, insurers, and resource stocks.
No complex factor backtesting.
Less sector-specific modeling than professional platforms.
For serious research, validate the company’s fundamentals with annual reports and filings.
Technical Analysis, Real-Time Data & Trading
This platform serves long-term, buy-and-hold fundamental strategies. It is not built for fast trading.
It does not offer:
Real-time tick data.
Advanced intraday charts.
Trade execution.
Complex technical indicator systems.
If you need trading tools, pair Simply Wall St with a brokerage or charting platform.
Data Gaps, Coverage Limits & Bugs
Large and mid-cap companies are usually well covered, but smaller listings can have gaps. Some users report missing tickers, stale data, partial histories, or sync issues in smaller markets.
The platform is limited to equities, excluding mutual funds and cryptocurrencies, so it cannot fully track every diversified portfolio.
Pricing, Auto-Renewal & Perceived Value
Pricing is reasonable versus many $50–$200/month research tools, but hobby investors may still find Premium or Unlimited expensive.
Best practices:
Start with the free version.
Try monthly billing before annual billing.
Set a renewal reminder.
Save support emails.
Cancel early if you only want a short test.
Who Should Use Simply Wall St (and Who Should Skip It)
The value depends on your investing style, portfolio size, and tolerance for automated analysis.
Best-Fit Users: Beginners to Intermediate Long-Term Investors
Simply Wall St fits:
Beginners learning stock analysis.
Dividend investors tracking income.
Long-term stock pickers focused on intrinsic value.
DIY retirement savers.
Intermediate investors who want quick idea filters.
It is also useful for investors who want learning resources alongside practical tools.
Who Might Want to Look Elsewhere
Skip or supplement Simply Wall St if you are:
A day trader.
An options scalper.
A high-frequency trader.
A professional analyst needing custom models.
An investor focused mainly on bonds, mutual funds, or crypto.
You can still use its visual summaries, but it should not be your main terminal.
Simply Wall St App Experience (Mobile Review)
The Simply Wall St app for iOS and Android mirrors much of the web experience. You can log in, check your portfolio, review Snowflakes, read company reports, and monitor alerts from your phone.
The app is clean and easy to navigate, especially for checking a company before buying or selling. It works well for quick portfolio reviews, dividend checks, and watchlist updates.
However, deeper portfolio editing and screener setup are easier on desktop. Some mobile users also report broker sync problems or slow loading, especially when tracking multiple accounts.

FAQ: Accuracy, Data Updates & Coverage
Here are quick answers to common questions before choosing a plan.
How Accurate Is Simply Wall St’s Data and Valuation?
Core earnings, cash flow, balance sheet, and dividend data are generally reliable for large and mid-cap companies because Simply Wall St uses reputable data providers.
Valuation outputs are estimates. Intrinsic value and fair value are useful guides, not precise targets. Always verify surprising numbers against filings or brokerage data.
How Often Is Data Updated on Simply Wall St?
Stock and company data is typically refreshed daily. Earnings, dividends, and major updates are usually added shortly after release.
Daily updates are enough for long-term investors, but not for short-term traders who need real-time data.
Does Simply Wall St Cover International Stocks?
Yes. Simply Wall St offers broad international coverage, including the U.S., Canada, U.K., Europe, Australia, and many Asia-Pacific exchanges.
This makes it helpful for global investors comparing wall street names with non-U.S. opportunities across the wider market.
Can You Use Simply Wall St for Free, or Is a Subscription Necessary?
You can use Simply Wall St for free after sign up, but the free tier has strict limits. Serious investors will likely want Premium or Unlimited if they need more reports, alerts, and broker syncing.
Start free, test the workflow, then upgrade only if the platform saves time and improves your process.
Final Verdict: Is SimplyWall.St Worth It in 2026?
Simply Wall St is worth it if you want a visual, data-rich companion for long-term stock research. It is not a replacement for filings, expert reports, or trading software, but it can make analysis faster and easier.
The strongest reasons to subscribe are portfolio tracking, global company reports, discovery tools, and the Snowflake’s quick visual representation of risk and quality. Try the Free plan first, stress-test the Simply Wall St app and web platform for a month, then decide whether Premium or Unlimited matches your investing goals.
Rank of Top Stock Newsletters Last 3 Years, as of April 5, 2026
We are paid subscribers to dozens of stock and option newsletters. We actively track every recommendation from all of these services, calculate performance, and share our results of the top performing stock newsletters whose subscriptions fees are under $500. The main metric to look for is “Return vs S&P500” which is their return above that of the S&P500. So, based on April 5, 2026 prices:
Best Stock Newsletters Last 3 Years’ Performance
RankStock NewsletterPicksReturnReturnvs S&P500Picksw ProfitMax %ReturnCurrent Promotion
1.
 Alpha Picks+93%+75%72%1,571%May, 2026 Promotion:See all their picks & get $50 off
Summary: 2 picks per month based on Seeking Alpha’s Quant Rating; consistently beating the market every year since launch; tells you when to sell and they have sold almost half. See complete details in our Alpha Picks Review. Or get their Premium service to get their QUANT RATINGS on your stocks to better manage your current portfolio–read our Is Seeking Alpha Worth It? article to learn more about their Quant Ratings.
2.
 Zacks Value Investor+58%+46%53%1,134%May, 2026 Promotion:$1, then $495/yr
Summary: 10 stock picks per year on January 1st based on Zacks’ Quant Rating; Retail Price is $495/yr and includes 6 different services including those below. Read our Zacks Review.
3.
Zacks Top 10+31%+19%74%170%May, 2026 Promotion:$1, then $495/yr
Summary: 10 stock picks per year on January 1st based on Zacks’ Quant Rating; Retail Price is $495/yr and includes 6 different services. Read our Zacks Review.
4.
 Action Alerts Plus+20%+6%61%208%Current Promotion:None
Summary: 100-150 trades per year, lots of buying and selling and short-term trades. Read our Jim Cramer Review.
5.
 TipRanks SmartInvestor+13%+5%57%266%Current Promotion:Save $180
Summary: About 1 pick/week focusing on short term trades; Lifetime average return of 355% vs S&P500’s 149% since 2015. Retail Price is $379/yr. Read our TipRanks Review.
6.
Zacks Home Run Investor+7%+2%43%337%May, 2026 Promotion:$1, then $495/yr
Summary: 40-50 stock picks per year based on Zacks’ Quant Rating; Retail Price is $495/yr. Read our Zacks Review.
7.
 Moby.co+19%0%55%797%May, 2026 Promotion:Get #1 Stock Pick Free
Summary: All it requires is an email address to get their #1 stock pick free; 60+ stock picks per year, segmented by industry; consistently beating the market every year; retail price is $365/yr but save try it for $99. Read our Moby Review.
8.IBD Leaderboard ETF11%-1.8%n/an/aMay, 2026 Promotion:NONE
Summary: Maintains top 50 stocks to invest in based on IBD algorithm; Retail Price is $495/yr. Read our Investors Business Daily Review.
9.
Zacks Under $10+0.4%-3%33%263%May, 2026 Promotion:$1, then $495/yr
Summary: 40-50 stock picks per year based on Zacks’ Quant Rating; Retail Price is $495/yr. Read our Zacks Review.
10.Dogs of the Dow Strategy+6%–7%50%34%Current Promotion:None
Summary: Buy the 10 highest yielding dividends stocks in the Dow Jones Industrial Average on January 1st and sell on Dec 31st each year.
11.
 Stock Advisor+7%-17%59%141%May, 2026 Promotion:Get $100 Off
Summary: 2 picks/month and 2 Best Buy Stocks lists focusing on high growth potential stocks over 5 years; Retail Price is $199/yr. Read our Motley Fool Review.
12.
Rule Breakers+11%-18%51%208%Current Promotion:Save $200
Summary: Rule Breakers is included with the Fool’s Epic Service. Get 5 picks/month focusing on disruptive technology and business models; Lifetime average return of 355% vs S&P500’s 149% since 2005; Now part of Motley Fool Epic. Read our Motley Fool Epic Review.
Top Ranking Stock Newsletters based on their last 3 years of stock picks covering 2026, 2025, 2024, and 2023 performance as compared to S&P500. S&P500’s return is based on average return of S&P500 from date each stock pick is released. NOTE: To get these results you must buy equal dollar amounts of each pick on the date the stock pick is released. Investor Business Daily Top 50 based on performance of FFTY ETF. Performance as of April 5, 2026.