
Published on April 28th, 2026 by Bob Ciura
The financials sector industries include banks, insurance companies, asset managers, ratings agencies, and payment processors, among others.
Well-managed financials sector stocks are highly profitable, and pay dividends to shareholders.
Perhaps it is no surprise that there are 9 financials sector stocks on the list of Dividend Aristocrats, a group of just 69 stocks in the S&P 500 with at least 25 consecutive years of dividend increases.
You can download the full Dividend Aristocrats list, along with important metrics like dividend yields and price-to-earnings ratios, by clicking on the link below:

Disclaimer: Sure Dividend is not affiliated with S&P Global in any way. S&P Global owns and maintains The Dividend Aristocrats Index. The information in this article and downloadable spreadsheet is based on Sure Dividend’s own review, summary, and analysis of the S&P 500 Dividend Aristocrats ETF (NOBL) and other sources, and is meant to help individual investors better understand this ETF and the index upon which it is based. None of the information in this article or spreadsheet is official data from S&P Global. Consult S&P Global for official information.
The most appealing aspect of financials stocks, is that they tend to trade at price-to-earnings ratios well below the average earnings multiple of the broader stock market.
And, their dividend yields are often well above the S&P 500 average of 1.2%.
This article will rank the 9 financials sector stocks currently on the list of Dividend Aristocrats.
Table of Contents
The table of contents below allows for easy navigation. The stocks are listed by 5-year annual expected returns, from lowest to highest.
Financials Sector Dividend Aristocrat #9: Aflac Inc. (AFL)
Annual Expected Returns: 3.8%
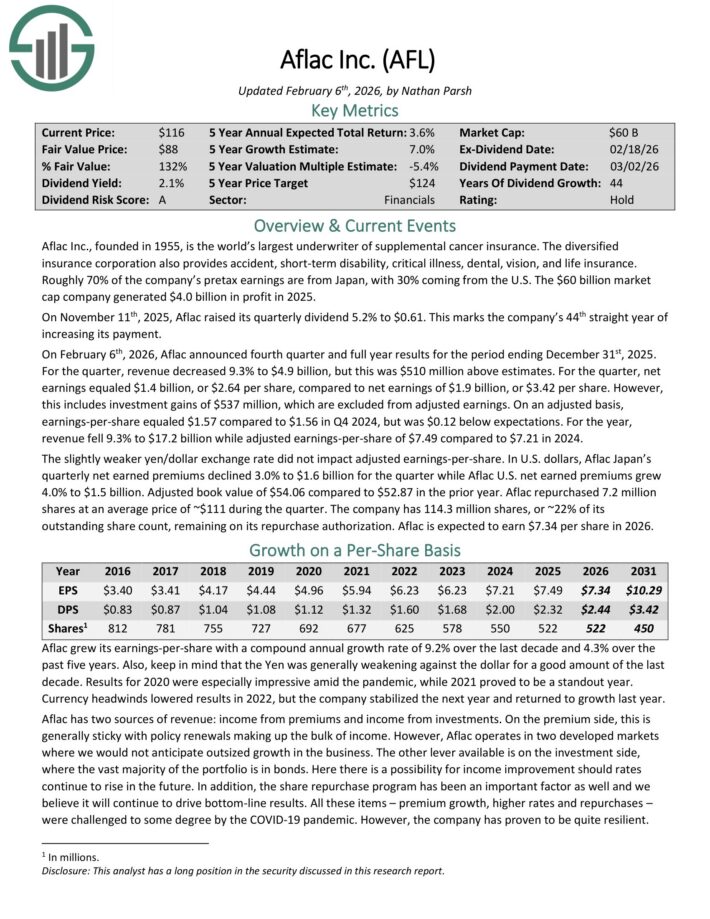
Aflac Inc., founded in 1955, is the world’s largest underwriter of supplemental cancer insurance.
The diversified insurance corporation also provides accident, short-term disability, critical illness, dental, vision, and life insurance.
Roughly 70% of the company’s pretax earnings are from Japan, with 30% coming from the U.S. The company generated $4.0 billion in profit in 2025.
Aflac has increased its dividend for 44 consecutive years.
On February 6th, 2026, Aflac announced fourth quarter and full year results for the period ending December 31st, 2025. For the quarter, revenue decreased 9.3% to $4.9 billion, but this was $510 million above estimates.
For the quarter, net earnings equaled $1.4 billion, or $2.64 per share, compared to net earnings of $1.9 billion, or $3.42 per share.
However, this includes investment gains of $537 million, which are excluded from adjusted earnings. On an adjusted basis, earnings-per-share equaled $1.57 compared to $1.56 in Q4 2024.
For the year, revenue fell 9.3% to $17.2 billion while adjusted earnings-per-share of $7.49 compared to $7.21 in 2024.
In U.S. dollars, Aflac Japan’s quarterly net earned premiums declined 3.0% to $1.6 billion for the quarter while Aflac U.S. net earned premiums grew 4.0% to $1.5 billion. Adjusted book value of $54.06 compared to $52.87 in the prior year.
Aflac is expected to earn $7.34 per share in 2026.
Click here to download our most recent Sure Analysis report on AFL (preview of page 1 of 3 shown below):
International Dividend Aristocrat #8: Chubb Ltd. (CB)
Annual Expected Returns: 6.6%
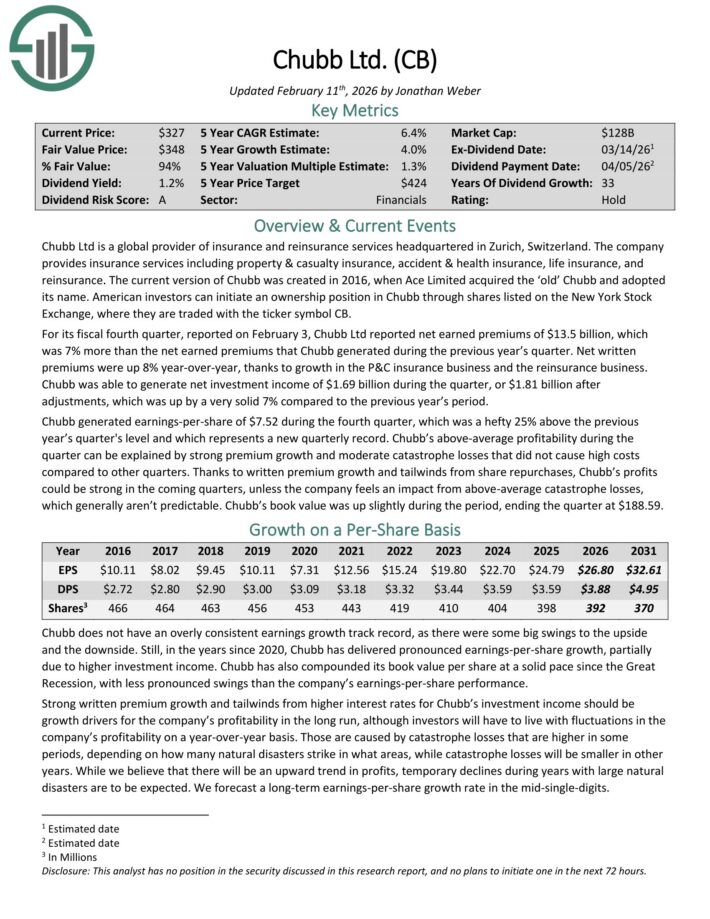
Chubb Ltd is a global provider of insurance and reinsurance services headquartered in Zurich, Switzerland.
The company provides insurance services including property & casualty insurance, accident & health insurance, life insurance, and reinsurance.
For its fiscal fourth quarter, reported on February 3, Chubb Ltd reported net earned premiums of $13.5 billion, which was 7% more than the net earned premiums that Chubb generated during the previous year’s quarter.
Net written premiums were up 8% year-over-year, thanks to growth in the P&C insurance business and the reinsurance business.
The company generated net investment income of $1.69 billion during the quarter, or $1.81 billion after adjustments, which was up by a very solid 7% compared to the previous year’s period.
Earnings-per-share of $7.52 during the fourth quarter, was 25% above the previous year’s quarter’s level and which represents a new quarterly record.
The above-average profitability during the quarter can be explained by strong premium growth and moderate catastrophe losses that did not cause high costs compared to other quarters.
Book value was up slightly during the period, ending the quarter at $188.59.
Click here to download our most recent Sure Analysis report on CB (preview of page 1 of 3 shown below):
Financials Sector Dividend Aristocrat #7: Franklin Resources (BEN)
Annual Expected Returns: 8.1%
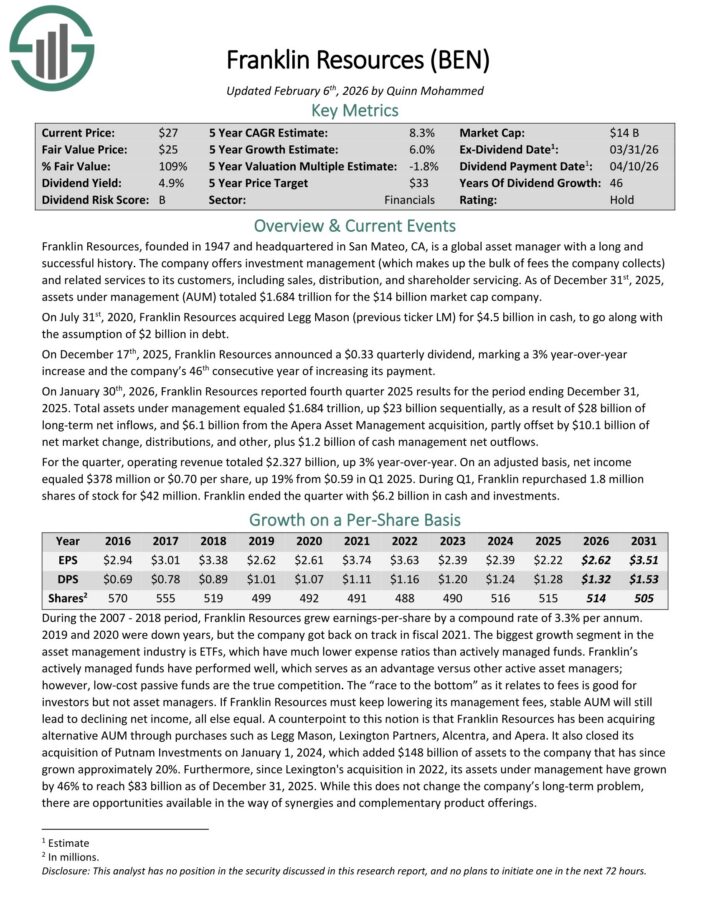
Franklin Resources is a global asset manager that offers investment management (which makes up the bulk of fees the company collects) and related services to its customers, including sales, distribution, and shareholder servicing.
As of December 31st, 2025, assets under management (AUM) totaled $1.684 trillion.
On December 17th, 2025, Franklin Resources announced a $0.33 quarterly dividend, marking a 3% year-over-year increase and the company’s 46th consecutive year of increasing its payment.
On January 30th, 2026, Franklin Resources reported fourth quarter 2025 results for the period ending December 31, 2025.
Total assets under management equaled $1.684 trillion, up $23 billion sequentially, as a result of $28 billion of long-term net inflows, and $6.1 billion from the Apera Asset Management acquisition.
For the quarter, operating revenue totaled $2.327 billion, up 3% year-over-year. On an adjusted basis, net income equaled $378 million or $0.70 per share, up 19% from $0.59 in Q1 2025.
During Q1, Franklin repurchased 1.8 million shares of stock for $42 million. Franklin ended the quarter with $6.2 billion in cash and investments.
For 2026, we expect BEN to generate EPS of $2.62.
Click here to download our most recent Sure Analysis report on BEN (preview of page 1 of 3 shown below):
Financials Sector Dividend Aristocrat #6: Cincinnati Financial (CINF)
Annual Expected Returns: 8.3%
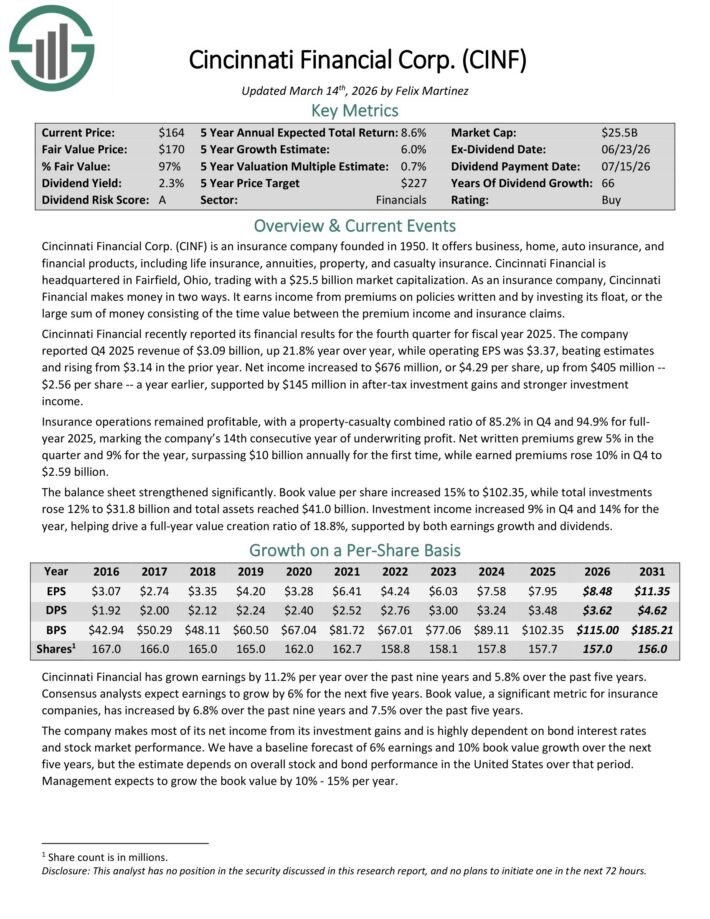
Cincinnati Financial is an insurance company founded in 1950. It offers business, home, auto insurance, and financial products, including life insurance, annuities, property, and casualty insurance.
Cincinnati Financial recently reported its financial results for the fourth quarter for fiscal year 2025. The company reported Q4 2025 revenue of $3.09 billion, up 21.8% year over year.
Operating EPS was $3.37, beating estimates and rising from $3.14 in the prior year. Net income increased to $676 million, or $4.29 per share, up from $405 million ($2.56 per share) a year earlier, supported by $145 million in after-tax investment gains and stronger investment income.
Insurance operations remained profitable, with a property-casualty combined ratio of 85.2% in Q4 and 94.9% for full-year 2025, marking the company’s 14th consecutive year of underwriting profit.
Net written premiums grew 5% in the quarter and 9% for the year, surpassing $10 billion annually for the first time, while earned premiums rose 10% in Q4 to $2.59 billion.
The balance sheet strengthened significantly. Book value per share increased 15% to $102.35, while total investments rose 12% to $31.8 billion and total assets reached $41.0 billion.
Investment income increased 9% in Q4 and 14% for the year, helping drive a full-year value creation ratio of 18.8%, supported by both earnings growth and dividends.
Click here to download our most recent Sure Analysis report on CINF (preview of page 1 of 3 shown below):
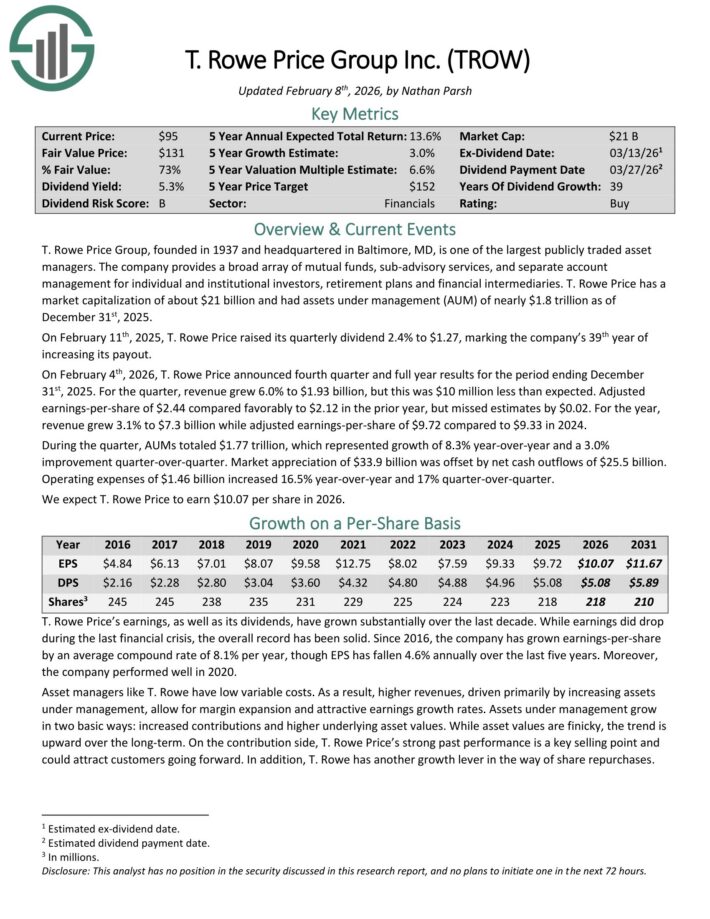
Financials Sector Dividend Aristocrat #5: T. Rowe Price Group (TROW)
Annual Expected Returns: 12.2%
T. Rowe Price Group is one of the largest publicly traded asset managers.
The company provides a broad array of mutual funds, sub-advisory services, and separate account management for individual and institutional investors, retirement plans and financial intermediaries.
T. Rowe Price had assets under management (AUM) of nearly $1.8 trillion as of December 31st, 2025.
On February 11th, 2025, T. Rowe Price raised its quarterly dividend 2.4% to $1.27, marking the company’s 39th year of increasing its payout.
On February 4th, 2026, T. Rowe Price announced fourth quarter and full year results for the period ending December 31st, 2025. For the quarter, revenue grew 6.0% to $1.93 billion, but this was $10 million less than expected.
Adjusted earnings-per-share of $2.44 compared favorably to $2.12 in the prior year, but missed estimates by $0.02. For the year, revenue grew 3.1% to $7.3 billion while adjusted earnings-per-share of $9.72 compared to $9.33 in 2024.
During the quarter, AUMs totaled $1.77 trillion, which represented growth of 8.3% year-over-year and a 3.0% improvement quarter-over-quarter.
Market appreciation of $33.9 billion was offset by net cash outflows of $25.5 billion. Operating expenses of $1.46 billion increased 16.5% year-over-year and 17% quarter-over-quarter.
Click here to download our most recent Sure Analysis report on TROW (preview of page 1 of 3 shown below):
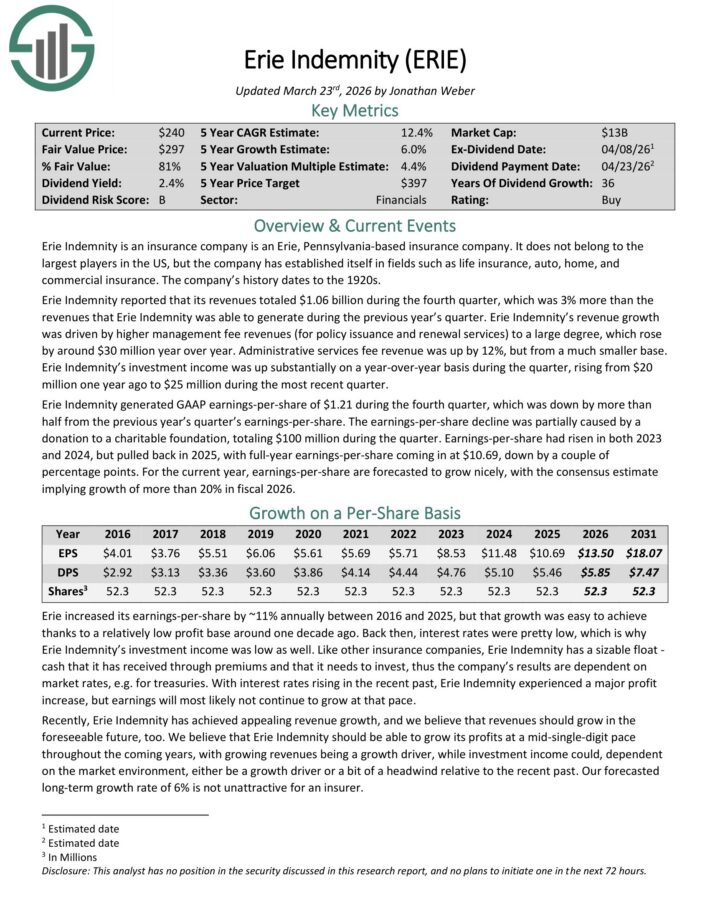
Financials Sector Dividend Aristocrat #4: Erie Indemnity Co. (ERIE)
Annual Expected Returns: 13.3%
Erie Indemnity is an insurance company is an Erie, Pennsylvania-based insurance company. It operates in fields such as life insurance, auto, home, and commercial insurance.
In the 2025 fourth quarter, revenue totaled $1.06 billion, which was 3% more than the previous year’s fourth quarter.
Growth was driven by higher management fee revenues (for policy issuance and renewal services) to a large degree, which rose by around $30 million year over year.
Administrative services fee revenue was up by 12%, but from a much smaller base. Erie Indemnity’s investment income was up substantially on a year-over-year basis during the quarter, rising from $20 million one year ago to $25 million during the most recent quarter.
Erie Indemnity generated GAAP earnings-per-share of $1.21 during the fourth quarter, which was down by more thanhalf from the previous year’s quarter’s earnings-per-share.
The earnings-per-share decline was partially caused by a donation to a charitable foundation, totaling $100 million during the quarter.
Earnings-per-share had risen in both 2023 and 2024, but pulled back in 2025, with full-year earnings-per-share coming in at $10.69, down by a couple of percentage points.
For the current year, earnings-per-share are forecast to grow, with the consensus estimate implying growth of more than 20% in fiscal 2026.
Click here to download our most recent Sure Analysis report on ERIE (preview of page 1 of 3 shown below):
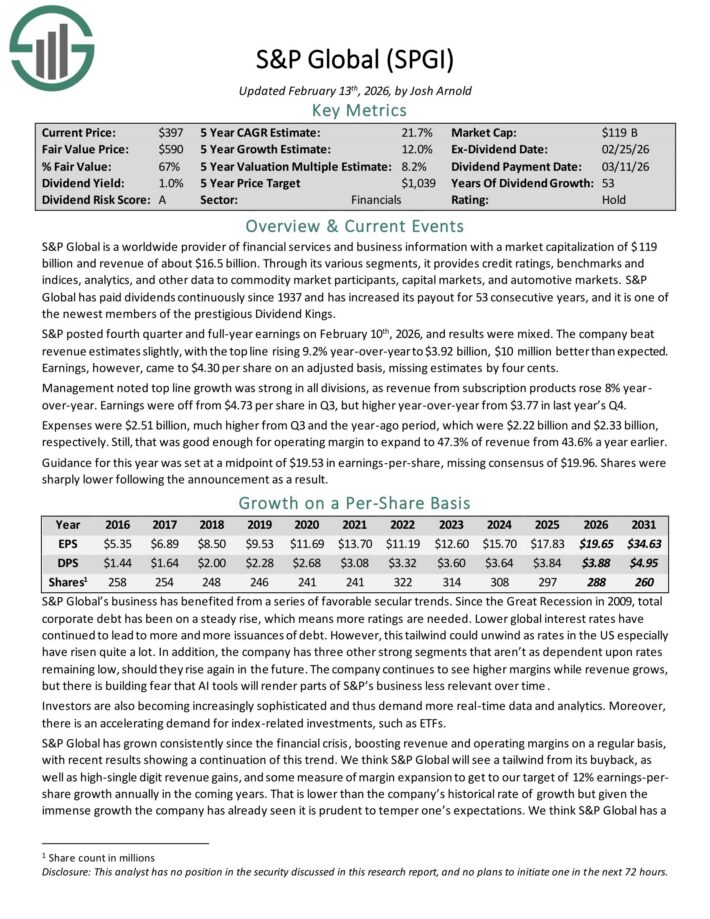
Financials Sector Dividend Aristocrat #3: S&P Global (SPGI)
Annual Expected Returns: 19.4%
S&P Global is a worldwide provider of financial services and business information with revenue of about $16.5 billion.
Through its various segments, it provides credit ratings, benchmarks and indices, analytics, and other data to commodity market participants, capital markets, and automotive markets.
S&P Global has paid dividends continuously since 1937 and has increased its payout for 53 consecutive years.
S&P posted fourth quarter and full-year earnings on February 10th, 2026, and results were mixed. The company beat revenue estimates slightly, with the top line rising 9.2% year-over-year to $3.92 billion, $10 million better than expected.
Earnings, however, came to $4.30 per share on an adjusted basis, missing estimates by four cents. Management noted top line growth was strong in all divisions, as revenue from subscription products rose 8% year-over-year.
Earnings were off from $4.73 per share in Q3, but higher year-over-year from $3.77 in last year’s Q4.
Expenses were $2.51 billion, much higher from Q3 and the year-ago period, which were $2.22 billion and $2.33 billion, respectively. Still, that was good enough for operating margin to expand to 47.3% of revenue from 43.6% a year earlier.
Click here to download our most recent Sure Analysis report on SPGI (preview of page 1 of 3 shown below):
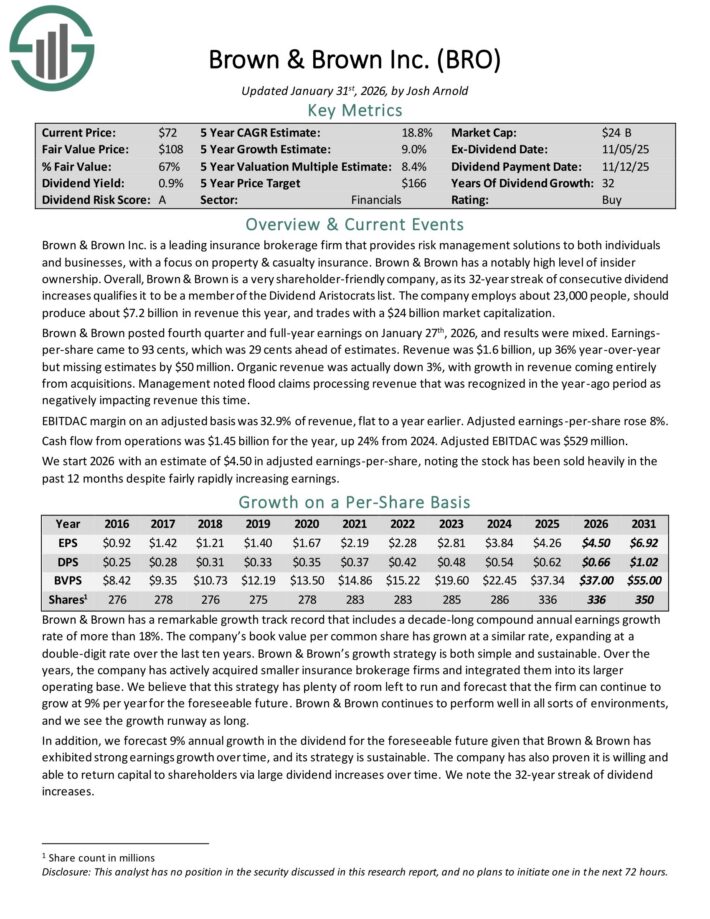
Financials Sector Dividend Aristocrat #2: Brown & Brown (BRO)
Annual Expected Returns: 21.5%
Brown & Brown Inc. is a leading insurance brokerage firm that provides risk management solutions to both individuals and businesses, with a focus on property & casualty insurance.
Brown & Brown posted fourth quarter and full-year earnings on January 27th, 2026, and results were mixed. Earnings-per-share came to 93 cents, which was 29 cents ahead of estimates.
Revenue was $1.6 billion, up 36% year-over-year but missing estimates by $50 million. Organic revenue was actually down 3%, with growth in revenue coming entirely from acquisitions.
Management noted flood claims processing revenue that was recognized in the year-ago period as negatively impacting revenue this time.
EBITDAC margin on an adjusted basis was 32.9% of revenue, flat to a year earlier. Adjusted earnings-per-share rose 8%.
Cash flow from operations was $1.45 billion for the year, up 24% from 2024. Adjusted EBITDAC was $529 million.
Click here to download our most recent Sure Analysis report on BRO (preview of page 1 of 3 shown below):
Financials Sector Dividend Aristocrat #1: Factset Research Systems (FDS)
Annual Expected Returns: 27.9%
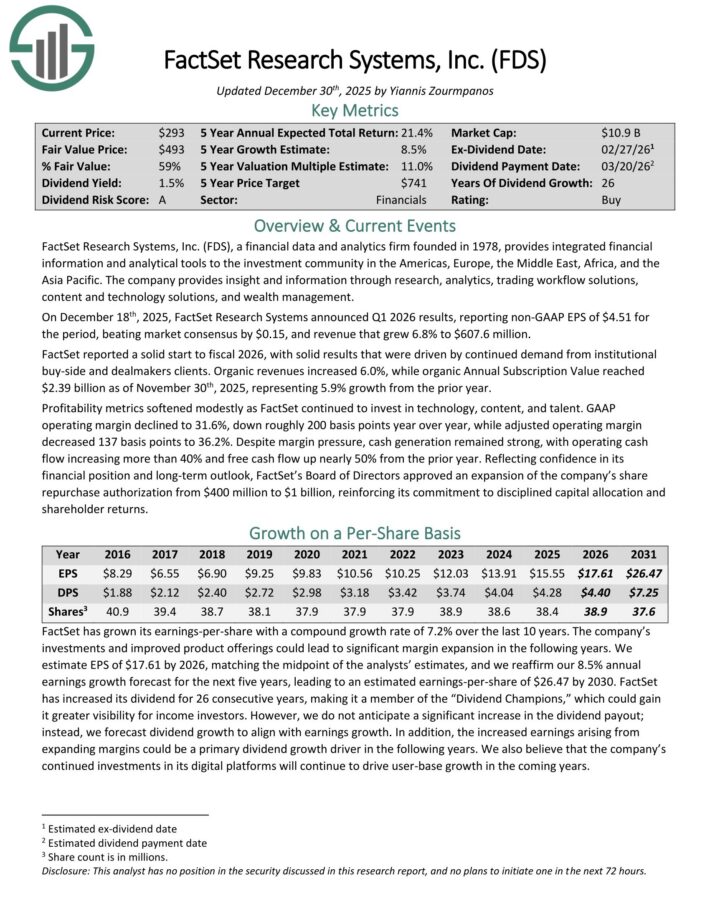
FactSet Research Systems provides integrated financial information and analytical tools to the investment community in the Americas, Europe, the Middle East, Africa, and Asia-Pacific.
The company provides insight and information through research, analytics, trading workflow solutions, content and technology solutions, and wealth management.
On December 18th, 2025, FactSet Research Systems announced Q1 2026 results, reporting non-GAAP EPS of $4.51 for the period, beating market consensus by $0.15, and revenue that grew 6.8% to $607.6 million.
FactSet reported a solid start to fiscal 2026, with solid results that were driven by continued demand from institutional buy-side and dealmakers clients.
Organic revenues increased 6.0%, while organic Annual Subscription Value reached $2.39 billion as of November 30th, 2025, representing 5.9% growth from the prior year.
Profitability metrics softened modestly as FactSet continued to invest in technology, content, and talent. GAAP operating margin declined to 31.6%, down roughly 200 basis points year over year, while adjusted operating margin decreased 137 basis points to 36.2%.
Despite margin pressure, cash generation remained strong, with operating cash flow increasing more than 40% and free cash flow up nearly 50% from the prior year.
Reflecting confidence in its financial position and long-term outlook, FactSet’s Board of Directors approved an expansion of the company’s share repurchase authorization from $400 million to $1 billion.
Click here to download our most recent Sure Analysis report on FDS (preview of page 1 of 3 shown below):
Additional Reading
The following Sure Dividend databases contain the most reliable dividend growers in our investment universe:
The Dividend Champions: Dividend stocks with 25+ years of dividend increases, including those that may not qualify as Dividend Aristocrats.
The Dividend Kings: considered to be the ultimate dividend growth stocks, the Dividend Kings list is comprised of stocks with 50+ years of consecutive dividend increases
The Blue Chip Stocks List: this database contains stocks that qualify as either Dividend Achievers, Dividend Aristocrats, or Dividend Kings.
Thanks for reading this article. Please send any feedback, corrections, or questions to [email protected].

")

 with This Scalable Rental Strategy")


 to Earn Extra Money")


")

