
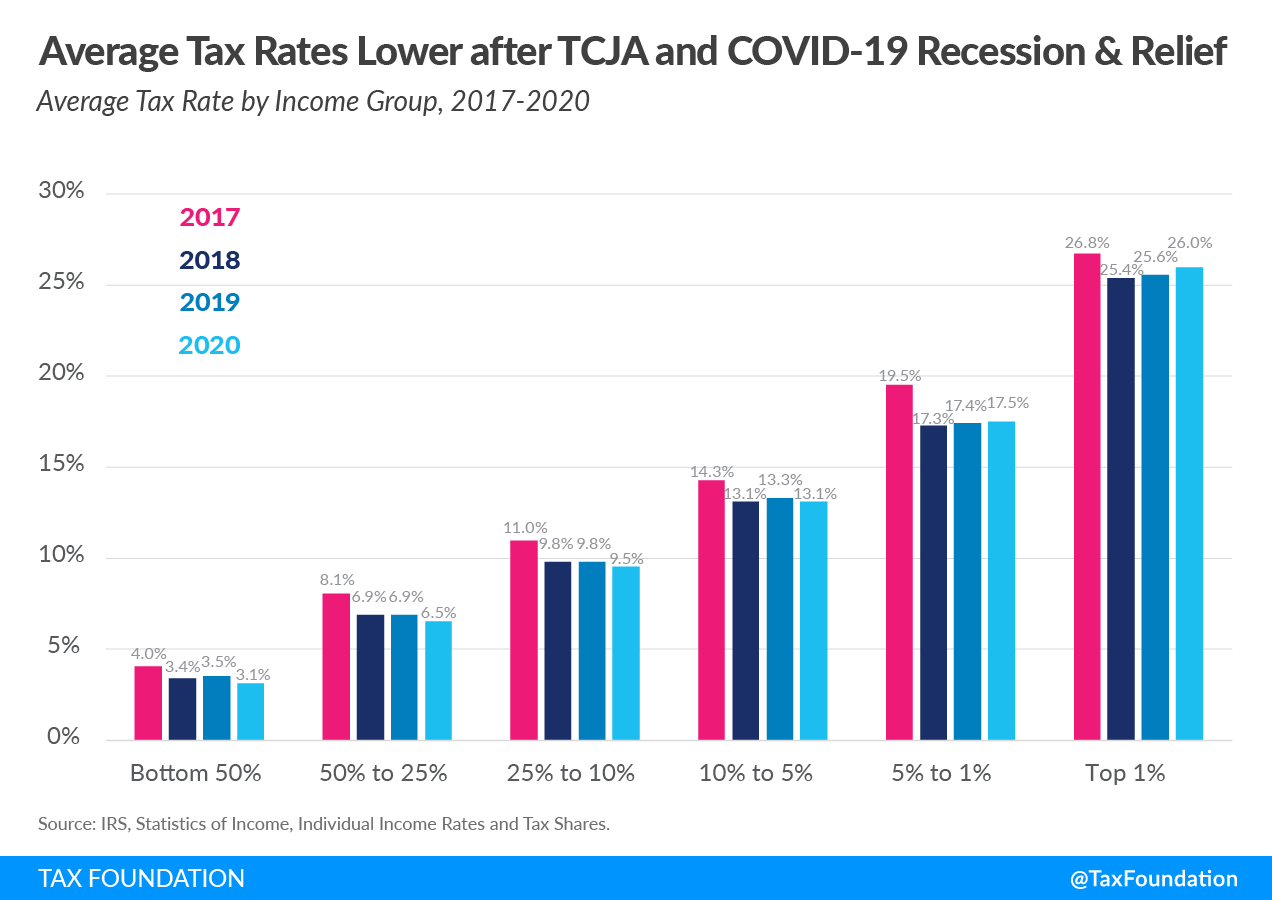
New Internal Revenue Service (IRS) data on individual income taxes for tax year 2020 shows the federal income tax system continues to be progressive as high-income taxpayers pay the highest average income tax rates.[1] Average tax rates for all income groups remained lower in 2020, three years after the Tax Cuts and Jobs Act, than they were in 2017 prior to the reform.
In 2020, taxpayers filed 157.5 million tax returns, reported earning nearly $12.5 trillion in adjusted gross income (AGI), and paid $1.7 trillion in individual income taxes.
The average income tax rate in 2020 was 13.6 percent. The top 1 percent of taxpayers paid a 25.99 percent average rate, more than eight times higher than the 3.1 percent average rate paid by the bottom half of taxpayers.
The top 1 percent’s income share rose from 20.1 percent in 2019 to 22.2 percent in 2020 and its share of federal income taxes paid rose from 38.8 percent to 42.3 percent.
The top 50 percent of all taxpayers paid 97.7 percent of all federal individual income taxes, while the bottom 50 percent paid the remaining 2.3 percent.
The 2020 figures include pandemic-related tax items such as the non-refundable part of the first two rounds of Recovery Rebates and the $10,200 unemployment compensation exclusion.
Reported Income and Taxes Paid Increased in Tax Year 2020
Taxpayers reported more than $12.5 trillion in AGI on 157.5 million tax returns in 2020, an increase of $650 million in AGI and 9.3 million in returns above 2019.[2] Total income taxes paid rose by $129 billion to $1.7 trillion, an 8 percent increase above 2019. The average individual income tax rate inched up slightly from 13.29 percent in 2019 to 13.63 percent in 2020.
Table 1. Summary of Federal Income Tax Data, Tax Year 2020
Top 1%
Top 5%
Top 10%
Top 25%
Top 50%
Bottom 50%
All Taxpayers
Number of Returns
1,574,942
7,874,712
15,749,424
39,373,561
78,747,121
78,747,121
157,494,242
Average Tax Rate
26.0%
22.4%
20.3%
17.1%
14.8%
3.1%
13.6%
Average Income Taxes Paid
$458,894
$136,091
$79,897
$38,396
$21,187
$504
$10,845
Adjusted Gross Income ($ millions)
$2,780,754
$4,775,995
$6,198,022
$8,862,578
$11,257,092
$1,276,009
$12,533,102
Share of Total Adjusted Gross Income
22.2%
38.1%
49.5%
70.7%
89.8%
10.2%
100.0%
Income Taxes Paid ($ millions)
$722,732
$1,071,681
$1,258,335
$1,511,786
$1,668,410
$39,671
$1,708,081
Share of Total Income Taxes Paid
42.3%
62.7%
73.7%
88.5%
97.7%
2.3%
100.0%
Income Split Point
$548,336
$220,521
$152,321
$85,853
$42,184
$42,184
Source: IRS, Statistics of Income, ”Individual Income Rates and Tax Shares.”
Because the Office of Management and Budget (OMB) classifies the refundable part of tax credits as spending, the IRS does not include it in tax share figures. The result overstates the tax burden of the bottom half of taxpayers.
Pandemic-Related Downturn and Relief Programs
The pandemic-related downturn and relief programs both affect the 2020 data. The recession caused financial hardships for many lower- and middle-income households. Between 2019 and 2020, AGI dropped by 6.6 percent for the bottom half of taxpayers, while it increased by 7 percent for the top half of taxpayers. As unemployment rose to record highs, lawmakers expanded unemployment benefits beginning in early 2020 and created a $10,200 income tax exclusion for the 2020 tax year, available to taxpayers with modified AGI below $150,000.[3]
Two rounds of Recovery Rebates also reduced tax liability for qualifying taxpayers.[4] The first round of payments provided $1,200 for single filers, $2,400 for joint filers, and $500 for each qualifying child. The second provided $600 for single filers, $1,200 for joint filers, and $600 for each qualifying child. Credit amounts began phasing out at $75,000 for single filers, $112,500 for head of household filers, and $150,000 for joint filers.
The income dip for the bottom half of taxpayers combined with the tax credit boost unavailable to higher-income households led to lower average tax rates at the bottom and a greater share of taxes borne by households at the top, compared to a typical year.
High-Income Taxpayers Paid the Highest Average Income Tax Rates
In 2020, taxpayers with higher incomes paid much higher average income tax rates than taxpayers with lower incomes.[5]
The bottom half of taxpayers, or taxpayers making under $42,184, faced an average income tax rate of 3.1 percent. As household income increases, average income tax rates rise. For example, taxpayers with AGI between the 10th and 5th percentiles ($152,321 and $220,521) paid an average income tax rate of 13.3 percent—almost four times the rate paid by taxpayers in the bottom half.
The top 1 percent of taxpayers (AGI of $548,336 and above) paid the highest average income tax rate of 25.99 percent—more than eight times the rate faced by the bottom half of taxpayers.
High-Income Taxpayers Paid the Majority of Federal Income Taxes
In 2020, the bottom half of taxpayers earned 10.2 percent of total AGI and paid 2.3 percent of all federal individual income taxes. The top 1 percent earned 22.2 percent of total AGI and paid 42.3 percent of all federal income taxes.
In all, the top 1 percent of taxpayers accounted for more income taxes paid than the bottom 90 percent combined. The top 1 percent of taxpayers paid $723 billion in income taxes while the bottom 90 percent paid $450 billion.

The share of income taxes paid by the top 1 percent increased from 33.2 percent in 2001 to 42.3 percent in 2020. Over the same period, the share paid by the bottom 50 percent of taxpayers fell from 4.9 percent to just over 2.3 percent in 2020.

Similarly, the share of adjusted gross income reported by the top 1 percent increased from 20.1 percent in 2019 to 22.2 percent in 2020. The AGI share of the top 1 percent fluctuates considerably over the business cycle, tending to rise and fall to a greater extent than income reported by other groups. The share of AGI reported by the bottom 50 percent of taxpayers fell from 14.4 percent in 2001 to 10.2 percent in 2020.

The Tax Cuts and Jobs Act Reduced Average Tax Rates Across Income Groups
The 2020 tax year was the third since the Tax Cuts and Jobs Act (TCJA). The TCJA made many significant, but temporary, changes to the individual income tax code to lower tax rates, widen brackets, increase the standard deduction and child tax credit, and more. The changes lowered tax burdens, on average, for taxpayers across all income levels. In 2020, lower-income taxpayers reported lower incomes due to the pandemic-induced recession, and lawmakers provided relief in the form of Recovery Rebate tax credits.
In 2020, individual taxpayers paid $1.7 trillion in individual income taxes. Compared to 2017, taxpayers paid $107 billion more in taxes while reporting nearly $1.6 trillion more in income. Average tax rates were lower in 2019 than in 2017 across all income groups. Average rates for the bottom 50 percent fell from 4.05 percent in 2017 to 3.11 percent in 2020; for the top 1 percent, they fell from 26.76 percent to 25.99 percent.
Appendix
For data prior to 2001, all tax returns that have a positive AGI are included, even those that do not have a positive income tax liability. For data from 2001 forward, returns with negative AGI are also included, but dependent returns are excluded.
Income tax after credits (the measure of “income taxes paid” above) does not account for the refundable portion of tax credits such as the Earned Income Tax Credit. If the refundable portion were included, the tax share of the top income groups would be higher and the average tax rate of bottom income groups would be lower. The refundable portion is classified as a spending program by the Office of Management and Budget (OMB) and therefore is not included by the IRS in these figures.
The only tax analyzed here is the federal individual income tax, which is responsible for more than 25 percent of the nation’s taxes paid (at all levels of government). Federal income taxes are much more progressive than federal payroll taxes, which are responsible for about 20 percent of all taxes paid (at all levels of government), and are more progressive than most state and local taxes.
AGI is a fairly narrow income concept and does not include income items like government transfers (except for the portion of Social Security benefits that is taxed), the value of employer-provided health insurance, underreported or unreported income (most notably that of sole proprietors), income derived from municipal bond interest, net imputed rental income, and others.
The unit of analysis here is the tax return. In the figures prior to 2001, some dependent returns are included. Under other units of analysis (like the U.S. Treasury Department’s Family Economic Unit), these returns would likely be paired with parents’ returns.
These figures represent the legal incidence of the income tax. Most distributional tables (such as those from the Congressional Budget Office, the Tax Policy Center, Citizens for Tax Justice, the Treasury Department, and the Joint Committee on Taxation) assume that the entire economic incidence of personal income taxes falls on the income earner.
Table 2. Number of Federal Individual Income Tax Returns Filed 1980–2020 (Thousands)
Year
Total
Top 0.1%
Top 1%
Between 1% and 5%
Top 5%
Between 5% and 10%
Top 10%
Between 10% and 25%
Top 25%
Between 25% and 50%
Top 50%
Bottom 50%
1981
94,587
946
3,783
4,729
4,729
9,459
14,188
23,647
23,647
47,293
47,293
1982
94,426
944
3,777
4,721
4,721
9,443
14,164
23,607
23,607
47,213
47,213
1983
95,331
953
3,814
4,767
4,767
9,533
14,300
23,833
23,833
47,665
47,665
1984
98,436
984
3,938
4,922
4,922
9,844
14,765
24,609
24,609
49,218
49,219
1985
100,625
1,006
4,025
5,031
5,031
10,063
15,094
25,156
25,156
50,313
50,313
1986
102,088
1,021
4,083
5,104
5,104
10,209
15,313
25,522
25,522
51,044
51,044
The Tax Reform Act of 1986 changed the definition of AGI, so data above and below this line is not strictly comparable.
1987
106,155
1,062
4,246
5,308
5,308
10,615
15,923
26,539
26,539
53,077
53,077
1988
108,873
1,089
4,355
5,444
5,444
10,887
16,331
27,218
27,218
54,436
54,436
1989
111,313
1,113
4,453
5,566
5,566
11,131
16,697
27,828
27,828
55,656
55,656
1990
112,812
1,128
4,513
5,641
5,641
11,281
16,922
28,203
28,203
56,406
56,406
1991
113,804
1,138
4,552
5,690
5,690
11,380
17,071
28,451
28,451
56,902
56,902
1992
112,653
1,127
4,506
5,633
5,633
11,265
16,898
28,163
28,163
56,326
56,326
1993
113,681
1,137
4,547
5,684
5,684
11,368
17,052
28,420
28,420
56,841
56,841
1994
114,990
1,150
4,599
5,749
5,749
11,499
17,248
28,747
28,747
57,495
57,495
1995
117,274
1,173
4,691
5,864
5,864
11,727
17,591
29,319
29,319
58,637
58,637
1996
119,442
1,194
4,778
5,972
5,972
11,944
17,916
29,860
29,860
59,721
59,721
1997
121,503
1,215
4,860
6,075
6,075
12,150
18,225
30,376
30,376
60,752
60,752
1998
123,776
1,238
4,951
6,189
6,189
12,378
18,566
30,944
30,944
61,888
61,888
1999
126,009
1,260
5,040
6,300
6,300
12,601
18,901
31,502
31,502
63,004
63,004
2000
128,227
1,282
5,129
6,411
6,411
12,823
19,234
32,057
32,057
64,114
64,114
The IRS changed methodology, so data above and below this line is not strictly comparable.
2001
119,371
119
1,194
4,775
5,969
5,969
11,937
17,906
29,843
29,843
59,685
59,685
2002
119,851
120
1,199
4,794
5,993
5,993
11,985
17,978
29,963
29,963
59,925
59,925
2003
120,759
121
1,208
4,830
6,038
6,038
12,076
18,114
30,190
30,190
60,379
60,379
2004
122,510
123
1,225
4,900
6,125
6,125
12,251
18,376
30,627
30,627
61,255
61,255
2005
124,673
125
1,247
4,987
6,234
6,234
12,467
18,701
31,168
31,168
62,337
62,337
2006
128,441
128
1,284
5,138
6,422
6,422
12,844
19,266
32,110
32,110
64,221
64,221
2007
132,655
133
1,327
5,306
6,633
6,633
13,265
19,898
33,164
33,164
66,327
66,327
2008
132,892
133
1,329
5,316
6,645
6,645
13,289
19,934
33,223
33,223
66,446
66,446
2009
132,620
133
1,326
5,305
6,631
6,631
13,262
19,893
33,155
33,155
66,310
66,310
2010
135,033
135
1,350
5,402
6,752
6,752
13,503
20,255
33,758
33,758
67,517
67,517
2011
136,586
137
1,366
5,463
6,829
6,829
13,659
20,488
34,146
34,146
68,293
68,293
2012
136,080
136
1,361
5,443
6,804
6,804
13,608
20,412
34,020
34,020
68,040
68,040
2013
138,313
138
1,383
5,533
6,916
6,916
13,831
20,747
34,578
34,578
69,157
69,157
2014
139,562
140
1,396
5,582
6,978
6,978
13,956
20,934
34,891
34,891
69,781
69,781
2015
141,205
141
1,412
5,648
7,060
7,060
14,120
21,181
35,301
35,301
70,602
70,602
2016
140,889
141
1,409
5,636
7,044
7,044
14,089
21,133
35,222
35,222
70,444
70,444
2017
143,295
143
1,433
5,732
7,165
7,165
14,330
21,494
35,824
35,824
71,648
71,648
2018
144,318
144
1,443
5,773
7,216
7,216
14,432
21,648
36,079
36,079
72,159
72,159
2019
148,246
148
1,482
5,930
7,412
7,412
14,825
22,237
37,061
37,061
74,123
74,123
2020
157,494
157
1,575
6,300
7,875
7,875
15,749
23,624
39,374
39,374
78,747
78,747
Source: IRS, Statistics of Income, Individual Income Rates and Tax Shares (2019).
Table 3. Adjusted Gross Income of Taxpayers in Various Income Brackets, 1980–2020 ($Billions)
Year
Total
Top 0.1%
Top 1%
Between 1% and 5%
Top 5%
Between 5% & 10%
Top 10%
Between 10% & 25%
Top 25%
Between 25% & 50%
Top 50%
Bottom 50%
1980
$1,627
$138
$204
$342
$181
$523
$400
$922
$417
$1,339
$288
1981
$1,791
$149
$223
$372
$201
$573
$442
$1,015
$458
$1,473
$318
1982
$1,876
$167
$231
$398
$207
$605
$460
$1,065
$478
$1,544
$332
1983
$1,970
$183
$245
$428
$217
$646
$481
$1,127
$498
$1,625
$344
1984
$2,173
$210
$272
$482
$240
$723
$528
$1,251
$543
$1,794
$379
1985
$2,344
$235
$296
$531
$260
$791
$567
$1,359
$580
$1,939
$405
1986
$2,524
$285
$323
$608
$278
$887
$604
$1,490
$613
$2,104
$421
The Tax Reform Act of 1986 changed the definition of AGI, so data above and below this line is not strictly comparable.
1987
$2,814
$347
$375
$722
$316
$1,038
$671
$1,709
$664
$2,374
$440
1988
$3,124
$474
$417
$891
$342
$1,233
$718
$1,951
$707
$2,658
$466
1989
$3,299
$468
$450
$918
$368
$1,287
$768
$2,054
$751
$2,805
$494
1990
$3,451
$483
$470
$953
$385
$1,338
$806
$2,144
$788
$2,933
$519
1991
$3,516
$457
$486
$943
$400
$1,343
$832
$2,175
$809
$2,984
$532
1992
$3,681
$524
$507
$1,031
$413
$1,444
$856
$2,299
$832
$3,131
$549
1993
$3,776
$521
$527
$1,048
$426
$1,474
$883
$2,358
$854
$3,212
$563
1994
$3,961
$547
$556
$1,103
$449
$1,552
$929
$2,481
$890
$3,371
$590
1995
$4,245
$620
$603
$1,223
$482
$1,705
$985
$2,690
$938
$3,628
$617
1996
$4,591
$737
$657
$1,394
$515
$1,909
$1,043
$2,953
$992
$3,944
$646
1997
$5,023
$873
$724
$1,597
$554
$2,151
$1,116
$3,268
$1,060
$4,328
$695
1998
$5,469
$1,010
$787
$1,797
$597
$2,394
$1,196
$3,590
$1,132
$4,721
$748
1999
$5,909
$1,153
$859
$2,012
$641
$2,653
$1,274
$3,927
$1,199
$5,126
$783
2000
$6,424
$1,337
$930
$2,267
$688
$2,955
$1,358
$4,314
$1,276
$5,590
$834
The IRS changed methodology, so data above and below this line is not strictly comparable.
2001
$6,116
$492
$1,065
$869
$1,934
$666
$2,600
$1,334
$3,933
$1,302
$5,235
$881
2002
$5,982
$421
$960
$852
$1,812
$660
$2,472
$1,339
$3,812
$1,303
$5,115
$867
2003
$6,157
$466
$1,030
$878
$1,908
$679
$2,587
$1,375
$3,962
$1,325
$5,287
$870
2004
$6,735
$615
$1,279
$964
$2,243
$725
$2,968
$1,455
$4,423
$1,403
$5,826
$908
2005
$7,366
$784
$1,561
$1,062
$2,623
$778
$3,401
$1,540
$4,940
$1,473
$6,413
$953
2006
$7,970
$895
$1,761
$1,157
$2,918
$841
$3,760
$1,652
$5,412
$1,568
$6,980
$990
2007
$8,622
$1,030
$1,971
$1,252
$3,223
$905
$4,128
$1,770
$5,898
$1,673
$7,571
$1,051
2008
$8,206
$826
$1,657
$1,211
$2,868
$905
$3,773
$1,782
$5,555
$1,673
$7,228
$978
2009
$7,579
$602
$1,305
$1,134
$2,439
$878
$3,317
$1,740
$5,058
$1,620
$6,678
$900
2010
$8,040
$743
$1,517
$1,199
$2,716
$915
$3,631
$1,800
$5,431
$1,665
$7,096
$944
2011
$8,317
$737
$1,556
$1,263
$2,819
$956
$3,775
$1,866
$5,641
$1,716
$7,357
$961
2012
$9,042
$1,017
$1,977
$1,354
$3,331
$997
$4,328
$1,934
$6,262
$1,776
$8,038
$1,004
2013
$9,034
$816
$1,720
$1,389
$3,109
$1,034
$4,143
$2,008
$6,152
$1,844
$7,996
$1,038
2014
$9,709
$986
$1,998
$1,493
$3,491
$1,093
$4,583
$2,107
$6,690
$1,924
$8,615
$1,094
2015
$10,143
$1,033
$2,095
$1,564
$3,659
$1,145
$4,803
$2,194
$6,998
$2,000
$8,998
$1,145
2016
$10,157
$966
$2,003
$1,572
$3,575
$1,155
$4,729
$2,221
$6,950
$2,030
$8,980
$1,177
2017
$10,937
$1,150
$2,301
$1,694
$3,995
$1,226
$5,221
$2,340
$7,561
$2,145
$9,706
$1,230
2018
$11,564
$1,197
$2,420
$1,798
$4,218
$1,293
$5,511
$2,458
$7,969
$2,253
$10,222
$1,342
2019
$11,883
$1,141
$2,393
$1,876
$4,270
$1,351
$5,621
$2,556
$8,177
$2,340
$10,517
$1,366
2020
$12,533
$1,419
$2,781
$1,995
$4,776
$1,422
$6,198
$2,665
$8,863
$2,395
$11,257
$1,276
Source: IRS, Statistics of Income, Individual Income Rates and Tax Shares (2019).
Table 4. Total Income Tax after Credits, 1980–2019 ($Billions)
Year
Total
Top 0.1%
Top 1%
Between 1% and 5%
Top 5%
Between 5% & 10%
Top 10%
Between 10% & 25%
Top 25%
Between 25% & 50%
Top 50%
Bottom 50%
1980
$249
$47
$45
$92
$31
$123
$59
$182
$50
$232
$18
1981
$282
$50
$49
$99
$36
$135
$69
$204
$57
$261
$21
1982
$276
$53
$47
$100
$34
$134
$66
$200
$56
$256
$20
1983
$272
$55
$46
$101
$34
$135
$64
$199
$54
$252
$19
1984
$297
$63
$50
$113
$37
$150
$68
$219
$57
$276
$22
1985
$322
$70
$55
$125
$41
$166
$73
$238
$60
$299
$23
1986
$367
$94
$62
$156
$44
$201
$78
$279
$64
$343
$24
The Tax Reform Act of 1986 changed the definition of AGI, so data above and below this line is not strictly comparable.
1987
$369
$92
$68
$160
$46
$205
$79
$284
$63
$347
$22
1988
$413
$114
$74
$188
$48
$236
$85
$321
$68
$389
$24
1989
$433
$109
$81
$190
$51
$241
$93
$334
$73
$408
$25
1990
$447
$112
$83
$195
$52
$248
$97
$344
$77
$421
$26
1991
$448
$111
$83
$194
$56
$250
$96
$347
$77
$424
$25
1992
$476
$131
$87
$218
$58
$276
$97
$374
$78
$452
$24
1993
$503
$146
$92
$238
$60
$298
$101
$399
$80
$479
$24
1994
$535
$154
$100
$254
$64
$318
$108
$425
$84
$509
$25
1995
$588
$178
$110
$288
$70
$357
$115
$473
$88
$561
$27
1996
$658
$213
$122
$335
$76
$411
$124
$535
$95
$630
$28
1997
$727
$241
$136
$377
$82
$460
$134
$594
$102
$696
$31
1998
$788
$274
$151
$425
$88
$513
$139
$652
$103
$755
$33
1999
$877
$317
$169
$486
$97
$583
$150
$733
$109
$842
$35
2000
$981
$367
$187
$554
$106
$660
$164
$824
$118
$942
$38
The IRS changed methodology, so data above and below this line is not strictly comparable.
2001
$885
$139
$294
$168
$462
$101
$564
$158
$722
$120
$842
$43
2002
$794
$120
$263
$157
$420
$93
$513
$143
$657
$104
$761
$33
2003
$746
$115
$251
$148
$399
$85
$484
$133
$617
$98
$715
$30
2004
$829
$142
$301
$166
$467
$91
$558
$137
$695
$102
$797
$32
2005
$932
$176
$361
$188
$549
$98
$647
$145
$793
$106
$898
$33
2006
$1,020
$196
$402
$205
$607
$108
$715
$157
$872
$113
$986
$35
2007
$1,112
$221
$443
$223
$666
$117
$783
$170
$953
$122
$1,075
$37
2008
$1,029
$187
$386
$211
$597
$115
$712
$168
$880
$117
$997
$32
2009
$863
$146
$314
$188
$502
$101
$604
$146
$749
$93
$842
$21
2010
$949
$170
$355
$206
$561
$110
$670
$156
$827
$100
$927
$22
2011
$1,043
$168
$366
$223
$589
$123
$712
$181
$893
$120
$1,012
$30
2012
$1,185
$220
$451
$248
$699
$133
$831
$193
$1,024
$128
$1,152
$33
2013
$1,232
$228
$466
$255
$721
$139
$860
$203
$1,063
$135
$1,198
$34
2014
$1,374
$273
$543
$281
$824
$150
$974
$219
$1,193
$144
$1,337
$38
2015
$1,454
$284
$568
$298
$866
$160
$1,027
$233
$1,260
$154
$1,413
$41
2016
$1,442
$261
$538
$302
$840
$162
$1,002
$238
$1,240
$159
$1,399
$44
2017
$1,601
$310
$616
$331
$947
$175
$1,122
$257
$1,379
$173
$1,552
$50
2018
$1,536
$311
$616
$311
$926
$170
$1,096
$240
$1,336
$155
$1,491
$45
2019
$1,579
$298
$612
$326
$938
$179
$1,118
$250
$1,368
$162
$1,530
$48
2020
$1,708
$377
$723
$349
$1,072
$187
$1,258
$253
$1,512
$157
$1,668
$40
Source: IRS, Statistics of Income, Individual Income Rates and Tax Shares
Table 5. Adjusted Gross Income Shares, 1980–2019 (percent of total AGI earned by each group)
Year
Total
Top 0.1%
Top 1%
Between 1% and 5%
Top 5%
Between 5% & 10%
Top 10%
Between 10% & 25%
Top 25%
Between 25% & 50%
Top 50%
Bottom 50%
1980
100%
8.46%
12.54%
21.01%
11.12%
32.13%
24.57%
56.70%
25.62%
82.32%
17.68%
1981
100%
8.30%
12.45%
20.78%
11.20%
31.98%
24.69%
56.67%
25.59%
82.25%
17.75%
1982
100%
8.91%
12.31%
21.23%
11.03%
32.26%
24.53%
56.79%
25.50%
82.29%
17.71%
1983
100%
9.29%
12.44%
21.74%
11.04%
32.78%
24.44%
57.22%
25.30%
82.52%
17.48%
1984
100%
9.66%
12.52%
22.19%
11.06%
33.25%
24.31%
57.56%
25.00%
82.56%
17.44%
1985
100%
10.03%
12.63%
22.67%
11.10%
33.77%
24.21%
57.97%
24.77%
82.74%
17.26%
1986
100%
11.30%
12.80%
24.11%
11.02%
35.12%
23.92%
59.04%
24.30%
83.34%
16.66%
The Tax Reform Act of 1986 changed the definition of AGI, so data above and below this line is not strictly comparable.
1987
100%
12.32%
13.33%
25.67%
11.23%
36.90%
23.85%
60.75%
23.62%
84.37%
15.63%
1988
100%
15.16%
13.35%
28.51%
10.94%
39.45%
22.99%
62.44%
22.63%
85.07%
14.93%
1989
100%
14.19%
13.64%
27.84%
11.16%
39.00%
23.28%
62.28%
22.76%
85.04%
14.96%
1990
100%
14.00%
13.62%
27.62%
11.15%
38.77%
23.36%
62.13%
22.84%
84.97%
15.03%
1991
100%
12.99%
13.82%
26.83%
11.37%
38.20%
23.65%
61.85%
23.01%
84.87%
15.13%
1992
100%
14.23%
13.77%
28.01%
11.21%
39.23%
23.25%
62.47%
22.61%
85.08%
14.92%
1993
100%
13.79%
13.96%
27.76%
11.29%
39.05%
23.40%
62.45%
22.63%
85.08%
14.92%
1994
100%
13.80%
14.04%
27.85%
11.34%
39.19%
23.45%
62.64%
22.48%
85.11%
14.89%
1995
100%
14.60%
14.20%
28.81%
11.35%
40.16%
23.21%
63.37%
22.09%
85.46%
14.54%
1996
100%
16.04%
14.31%
30.36%
11.23%
41.59%
22.73%
64.32%
21.60%
85.92%
14.08%
1997
100%
17.38%
14.41%
31.79%
11.03%
42.83%
22.22%
65.05%
21.11%
86.16%
13.84%
1998
100%
18.47%
14.39%
32.85%
10.92%
43.77%
21.87%
65.63%
20.69%
86.33%
13.67%
1999
100%
19.51%
14.54%
34.04%
10.85%
44.89%
21.57%
66.46%
20.29%
86.75%
13.25%
2000
100%
20.81%
14.48%
35.30%
10.71%
46.01%
21.15%
67.15%
19.86%
87.01%
12.99%
The IRS changed methodology, so data above and below this line is not strictly comparable.
2001
100%
8.05%
17.41%
14.21%
31.61%
10.89%
42.50%
21.80%
64.31%
21.29%
85.60%
14.40%
2002
100%
7.04%
16.05%
14.24%
30.29%
11.04%
41.33%
22.39%
63.71%
21.79%
85.50%
14.50%
2003
100%
7.56%
16.73%
14.26%
30.99%
11.03%
42.01%
22.33%
64.34%
21.52%
85.87%
14.13%
2004
100%
9.14%
18.99%
14.31%
33.31%
10.77%
44.07%
21.60%
65.68%
20.83%
86.51%
13.49%
2005
100%
10.64%
21.19%
14.42%
35.61%
10.56%
46.17%
20.90%
67.07%
19.99%
87.06%
12.94%
2006
100%
11.23%
22.10%
14.52%
36.62%
10.56%
47.17%
20.73%
67.91%
19.68%
87.58%
12.42%
2007
100%
11.95%
22.86%
14.52%
37.39%
10.49%
47.88%
20.53%
68.41%
19.40%
87.81%
12.19%
2008
100%
10.06%
20.19%
14.76%
34.95%
11.03%
45.98%
21.71%
67.69%
20.39%
88.08%
11.92%
2009
100%
7.94%
17.21%
14.96%
32.18%
11.59%
43.77%
22.96%
66.74%
21.38%
88.12%
11.88%
2010
100%
9.24%
18.87%
14.91%
33.78%
11.38%
45.17%
22.38%
67.55%
20.71%
88.26%
11.74%
2011
100%
8.86%
18.70%
15.19%
33.89%
11.50%
45.39%
22.43%
67.82%
20.63%
88.45%
11.55%
2012
100%
11.25%
21.86%
14.97%
36.84%
11.03%
47.87%
21.39%
69.25%
19.64%
88.90%
11.10%
2013
100%
9.03%
19.04%
15.38%
34.42%
11.45%
45.87%
22.23%
68.10%
20.41%
88.51%
11.49%
2014
100%
10.16%
20.58%
15.38%
35.96%
11.25%
47.21%
21.70%
68.91%
19.82%
88.73%
11.27%
2015
100%
10.19%
20.65%
15.42%
36.07%
11.29%
47.36%
21.64%
68.99%
19.72%
88.72%
11.28%
2016
100%
9.52%
19.72%
15.48%
35.20%
11.37%
46.56%
21.86%
68.43%
19.98%
88.41%
11.59%
2017
100%
10.52%
21.04%
15.49%
36.53%
11.21%
47.74%
21.40%
69.14%
19.61%
88.75%
11.25%
2018
100%
10.35%
20.93%
15.55%
36.48%
11.18%
47.66%
21.26%
68.91%
19.48%
88.39%
11.61%
2019
100%
9.60%
20.14%
15.79%
35.93%
11.37%
47.30%
21.51%
68.82%
19.69%
88.51%
11.49%
2020
100%
11.32%
22.19%
15.92%
38.11%
11.35%
49.45%
21.26%
70.71%
19.11%
89.82%
10.18%
Source: IRS, Statistics of Income, Individual Income Rates and Tax Shares
Table 6. Total Income Tax Shares, 1980–2019 (percent of federal income tax paid by each group)
Year
Total
Top 0.1%
Top 1%
Between 1% and 5%
Top 5%
Between 5% & 10%
Top 10%
Between 10% & 25%
Top 25%
Between 25% & 50%
Top 50%
Bottom 50%
1980
100%
19.05%
17.79%
36.84%
12.44%
49.28%
23.74%
73.02%
19.93%
92.95%
7.05%
1981
100%
17.58%
17.48%
35.06%
12.90%
47.96%
24.33%
72.29%
20.26%
92.55%
7.45%
1982
100%
19.03%
17.10%
36.13%
12.45%
48.59%
23.91%
72.50%
20.15%
92.65%
7.35%
1983
100%
20.32%
16.94%
37.26%
12.44%
49.71%
23.39%
73.10%
19.73%
92.83%
7.17%
1984
100%
21.12%
16.86%
37.98%
12.58%
50.56%
22.92%
73.49%
19.16%
92.65%
7.35%
1985
100%
21.81%
16.97%
38.78%
12.67%
51.46%
22.60%
74.06%
18.77%
92.83%
7.17%
1986
100%
25.75%
16.82%
42.57%
12.12%
54.69%
21.33%
76.02%
17.52%
93.54%
6.46%
The Tax Reform Act of 1986 changed the definition of AGI, so data above and below this line is not strictly comparable.
1987
100%
24.81%
18.45%
43.26%
12.35%
55.61%
21.31%
76.92%
17.02%
93.93%
6.07%
1988
100%
27.58%
18.04%
45.62%
11.66%
57.28%
20.57%
77.84%
16.44%
94.28%
5.72%
1989
100%
25.24%
18.70%
43.94%
11.85%
55.78%
21.44%
77.22%
16.94%
94.17%
5.83%
1990
100%
25.13%
18.51%
43.64%
11.73%
55.36%
21.66%
77.02%
17.16%
94.19%
5.81%
1991
100%
24.82%
18.56%
43.38%
12.45%
55.82%
21.46%
77.29%
17.23%
94.52%
5.48%
1992
100%
27.54%
18.34%
45.88%
12.12%
58.01%
20.47%
78.48%
16.46%
94.94%
5.06%
1993
100%
29.01%
18.35%
47.36%
11.88%
59.24%
20.03%
79.27%
15.92%
95.19%
4.81%
1994
100%
28.86%
18.66%
47.52%
11.93%
59.45%
20.10%
79.55%
15.68%
95.23%
4.77%
1995
100%
30.26%
18.65%
48.91%
11.84%
60.75%
19.62%
80.36%
15.03%
95.39%
4.61%
1996
100%
32.31%
18.66%
50.97%
11.54%
62.51%
18.80%
81.32%
14.36%
95.68%
4.32%
1997
100%
33.17%
18.70%
51.87%
11.33%
63.20%
18.47%
81.67%
14.05%
95.72%
4.28%
1998
100%
34.75%
19.09%
53.84%
11.20%
65.04%
17.65%
82.69%
13.10%
95.79%
4.21%
1999
100%
36.18%
19.27%
55.45%
11.00%
66.45%
17.09%
83.54%
12.46%
96.00%
4.00%
2000
100%
37.42%
19.05%
56.47%
10.86%
67.33%
16.68%
84.01%
12.08%
96.09%
3.91%
The IRS changed methodology, so data above and below this line is not strictly comparable.
2001
100%
15.68%
33.22%
19.02%
52.24%
11.44%
63.68%
17.88%
81.56%
13.54%
95.10%
4.90%
2002
100%
15.09%
33.09%
19.77%
52.86%
11.77%
64.63%
18.04%
82.67%
13.12%
95.79%
4.21%
2003
100%
15.37%
33.69%
19.85%
53.54%
11.35%
64.89%
17.87%
82.76%
13.17%
95.93%
4.07%
2004
100%
17.12%
36.28%
20.07%
56.35%
10.96%
67.30%
16.52%
83.82%
12.31%
96.13%
3.87%
2005
100%
18.91%
38.78%
20.15%
58.93%
10.52%
69.46%
15.61%
85.07%
11.35%
96.41%
3.59%
2006
100%
19.24%
39.36%
20.13%
59.49%
10.59%
70.08%
15.41%
85.49%
11.10%
96.59%
3.41%
2007
100%
19.84%
39.81%
20.09%
59.90%
10.51%
70.41%
15.30%
85.71%
10.93%
96.64%
3.36%
2008
100%
18.20%
37.51%
20.55%
58.06%
11.14%
69.20%
16.37%
85.57%
11.33%
96.90%
3.10%
2009
100%
16.91%
36.34%
21.83%
58.17%
11.72%
69.89%
16.85%
86.74%
10.80%
97.54%
2.46%
2010
100%
17.88%
37.38%
21.69%
59.07%
11.55%
70.62%
16.49%
87.11%
10.53%
97.64%
2.36%
2011
100%
16.14%
35.06%
21.43%
56.49%
11.77%
68.26%
17.36%
85.62%
11.50%
97.11%
2.89%
2012
100%
18.60%
38.09%
20.86%
58.95%
11.22%
70.17%
16.25%
86.42%
10.80%
97.22%
2.78%
2013
100%
18.48%
37.80%
20.75%
58.55%
11.25%
69.80%
16.47%
86.27%
10.94%
97.22%
2.78%
2014
100%
19.85%
39.48%
20.49%
59.97%
10.91%
70.88%
15.90%
86.78%
10.47%
97.25%
2.75%
2015
100%
19.50%
39.04%
20.54%
59.58%
11.01%
70.59%
16.03%
86.62%
10.55%
97.17%
2.83%
2016
100.00%
18.12%
37.32%
20.91%
58.23%
11.24%
69.47%
16.50%
85.97%
10.99%
96.96%
3.04%
2017
100.00%
19.34%
38.47%
20.67%
59.14%
10.94%
70.08%
16.02%
86.10%
10.79%
96.89%
3.11%
2018
100.00%
20.22%
40.08%
20.22%
60.30%
11.06%
71.37%
15.60%
86.97%
10.09%
97.06%
2.94%
2019
100.00%
18.87%
38.77%
20.68%
59.44%
11.37%
70.81%
15.84%
86.65%
10.29%
96.94%
3.06%
2020
100.00%
22.06%
42.31%
20.43%
62.74%
10.93%
73.67%
14.84%
88.51%
9.17%
97.68%
2.32%
Source: IRS, Statistics of Income, Individual Income Rates and Tax Shares
Table 7. Dollar Cut-Off, 1980–2019 (Minimum AGI for Tax Returns to Fall into Various Percentiles; Thresholds Not Adjusted for Inflation)
Year
Top 0.1%
Top 1%
Top 5%
Top 10%
Top 25%
Top 50%
1980
$80,580
$43,792
$35,070
$23,606
$12,936
1981
$85,428
$47,845
$38,283
$25,655
$14,000
1982
$89,388
$49,284
$39,676
$27,027
$14,539
1983
$93,512
$51,553
$41,222
$27,827
$15,044
1984
$100,889
$55,423
$43,956
$29,360
$15,998
1985
$108,134
$58,883
$46,322
$30,928
$16,688
1986
$118,818
$62,377
$48,656
$32,242
$17,302
The Tax Reform Act of 1986 changed the definition of AGI, so data above and below this line is not strictly comparable.
1987
$139,289
$68,414
$52,921
$33,983
$17,768
1988
$157,136
$72,735
$55,437
$35,398
$18,367
1989
$163,869
$76,933
$58,263
$36,839
$18,993
1990
$167,421
$79,064
$60,287
$38,080
$19,767
1991
$170,139
$81,720
$61,944
$38,929
$20,097
1992
$181,904
$85,103
$64,457
$40,378
$20,803
1993
$185,715
$87,386
$66,077
$41,210
$21,179
1994
$195,726
$91,226
$68,753
$42,742
$21,802
1995
$209,406
$96,221
$72,094
$44,207
$22,344
1996
$227,546
$101,141
$74,986
$45,757
$23,174
1997
$250,736
$108,048
$79,212
$48,173
$24,393
1998
$269,496
$114,729
$83,220
$50,607
$25,491
1999
$293,415
$120,846
$87,682
$52,965
$26,415
2000
$313,469
$128,336
$92,144
$55,225
$27,682
The IRS changed methodology, so data above and below this line is not strictly comparable.
2001
$1,393,718
$306,635
$132,082
$96,151
$59,026
$31,418
2002
$1,245,352
$296,194
$130,750
$95,699
$59,066
$31,299
2003
$1,317,088
$305,939
$133,741
$97,470
$59,896
$31,447
2004
$1,617,918
$339,993
$140,758
$101,838
$62,794
$32,622
2005
$1,938,175
$379,261
$149,216
$106,864
$64,821
$33,484
2006
$2,124,625
$402,603
$157,390
$112,016
$67,291
$34,417
2007
$2,251,017
$426,439
$164,883
$116,396
$69,559
$35,541
2008
$1,867,652
$392,513
$163,512
$116,813
$69,813
$35,340
2009
$1,469,393
$351,968
$157,342
$114,181
$68,216
$34,156
2010
$1,634,386
$369,691
$161,579
$116,623
$69,126
$34,338
2011
$1,717,675
$388,905
$167,728
$120,136
$70,492
$34,823
2012
$2,161,175
$434,682
$175,817
$125,195
$73,354
$36,055
2013
$1,860,848
$428,713
$179,760
$127,695
$74,955
$36,841
2014
$2,136,762
$465,626
$188,996
$133,445
$77,714
$38,173
2015
$2,220,264
$480,930
$195,778
$138,031
$79,655
$39,275
2016
$2,124,117
$480,804
$197,651
$139,713
$80,921
$40,078
2017
$2,374,937
$515,371
$208,053
$145,135
$83,682
$41,740
2018
$2,514,209
$540,009
$217,913
$151,935
$87,044
$43,614
2019
$2,458,432
$546,434
$221,572
$154,589
$87,917
$44,269
2020
$2,614,565
$548,336
$220,521
$152,321
$85,853
$42,184
Source: IRS, Statistics of Income, Individual Income Rates and Tax Shares
Table 8. Average Tax Rate, 1980–2019 (Percent of AGI Paid in Income Taxes)
Year
Total
Top 0.1%
Top 1%
Between 1% and 5%
Top 5%
Between 5% & 10%
Top 10%
Between 10% & 25%
Top 25%
Between 25% & 50%
Top 50%
Bottom 50%
1980
15.31%
34.47%
22.06%
26.85%
17.13%
23.49%
14.80%
19.72%
11.91%
17.29%
6.10%
1981
15.76%
33.37%
21.97%
26.59%
18.16%
23.64%
15.53%
20.11%
12.48%
17.73%
6.62%
1982
14.72%
31.43%
20.35%
25.05%
16.61%
22.17%
14.35%
18.79%
11.63%
16.57%
6.10%
1983
13.79%
30.18%
18.78%
23.64%
15.54%
20.91%
13.20%
17.62%
10.76%
15.52%
5.66%
1984
13.68%
29.92%
18.38%
23.42%
15.57%
20.81%
12.90%
17.47%
10.48%
15.35%
5.77%
1985
13.73%
29.86%
18.58%
23.50%
15.69%
20.93%
12.83%
17.55%
10.41%
15.41%
5.70%
1986
14.54%
33.13%
19.20%
25.68%
15.99%
22.64%
12.97%
18.72%
10.48%
16.32%
5.63%
The Tax Reform Act of 1986 changed the definition of AGI, so data above and below this line is not strictly comparable.
1987
13.12%
26.41%
18.13%
22.10%
14.43%
19.77%
11.71%
16.61%
9.45%
14.60%
5.09%
1988
13.21%
24.04%
17.75%
21.14%
14.07%
19.18%
11.82%
16.47%
9.60%
14.64%
5.06%
1989
13.12%
23.34%
18.00%
20.71%
13.93%
18.77%
12.08%
16.27%
9.77%
14.53%
5.11%
1990
12.95%
23.25%
17.66%
20.46%
13.63%
18.50%
12.01%
16.06%
9.73%
14.36%
5.01%
1991
12.75%
24.37%
17.08%
20.62%
13.96%
18.63%
11.57%
15.93%
9.55%
14.20%
4.62%
1992
12.94%
25.05%
17.16%
21.19%
13.99%
19.13%
11.39%
16.25%
9.42%
14.44%
4.39%
1993
13.32%
28.01%
17.46%
22.71%
14.01%
20.20%
11.40%
16.90%
9.37%
14.90%
4.29%
1994
13.50%
28.23%
17.99%
23.04%
14.20%
20.48%
11.57%
17.15%
9.42%
15.11%
4.32%
1995
13.86%
28.73%
18.24%
23.53%
14.46%
20.97%
11.71%
17.58%
9.43%
15.47%
4.39%
1996
14.34%
28.87%
18.57%
24.07%
14.74%
21.55%
11.86%
18.12%
9.53%
15.96%
4.40%
1997
14.48%
27.64%
18.78%
23.62%
14.87%
21.36%
12.04%
18.18%
9.63%
16.09%
4.48%
1998
14.42%
27.12%
19.19%
23.63%
14.79%
21.42%
11.63%
18.16%
9.12%
16.00%
4.44%
1999
14.85%
27.53%
19.67%
24.18%
15.06%
21.98%
11.76%
18.66%
9.12%
16.43%
4.48%
2000
15.26%
27.45%
20.11%
24.42%
15.48%
22.34%
12.04%
19.09%
9.28%
16.86%
4.60%
The IRS changed methodology, so data above and below this line is not strictly comparable.
2001
14.47%
28.17%
27.60%
19.33%
23.91%
15.20%
21.68%
11.87%
18.35%
9.20%
16.08%
4.92%
2002
13.28%
28.48%
27.37%
18.43%
23.17%
14.15%
20.76%
10.70%
17.23%
8.00%
14.87%
3.86%
2003
12.11%
24.60%
24.38%
16.86%
20.92%
12.46%
18.70%
9.69%
15.57%
7.41%
13.53%
3.49%
2004
12.31%
23.06%
23.52%
17.22%
20.83%
12.53%
18.80%
9.41%
15.71%
7.27%
13.68%
3.53%
2005
12.65%
22.48%
23.15%
17.70%
20.93%
12.61%
19.03%
9.45%
16.04%
7.18%
14.01%
3.51%
2006
12.80%
21.94%
22.80%
17.72%
20.80%
12.84%
19.02%
9.52%
16.12%
7.22%
14.12%
3.51%
2007
12.90%
21.42%
22.46%
17.81%
20.66%
12.92%
18.96%
9.61%
16.16%
7.27%
14.19%
3.56%
2008
12.54%
22.67%
23.29%
17.42%
20.83%
12.66%
18.87%
9.45%
15.85%
6.97%
13.79%
3.26%
2009
11.39%
24.28%
24.05%
16.58%
20.59%
11.53%
18.19%
8.36%
14.81%
5.76%
12.61%
2.35%
2010
11.81%
22.84%
23.39%
17.18%
20.64%
11.98%
18.46%
8.70%
15.22%
6.01%
13.06%
2.37%
2011
12.54%
22.82%
23.50%
17.66%
20.89%
12.83%
18.85%
9.70%
15.82%
6.98%
13.76%
3.13%
2012
13.11%
21.67%
22.83%
18.32%
20.97%
13.33%
19.21%
9.96%
16.35%
7.21%
14.33%
3.28%
2013
13.64%
27.91%
27.08%
18.36%
23.20%
13.40%
20.75%
10.11%
17.28%
7.31%
14.98%
3.30%
2014
14.16%
27.67%
27.16%
18.82%
23.61%
13.73%
21.25%
10.37%
17.83%
7.48%
15.52%
3.45%
2015
14.34%
27.44%
27.10%
19.05%
23.68%
13.99%
21.37%
10.62%
18.00%
7.67%
15.71%
3.59%
2016
14.20%
27.05%
26.87%
19.19%
23.49%
14.05%
21.19%
10.71%
17.84%
7.81%
15.57%
3.73%
2017
14.64%
26.93%
26.76%
19.54%
23.70%
14.29%
21.49%
10.96%
18.23%
8.06%
15.99%
4.05%
2018
13.28%
25.96%
25.44%
17.28%
21.96%
13.14%
19.89%
9.75%
16.77%
6.88%
14.59%
3.36%
2019
13.29%
26.12%
25.57%
17.40%
21.98%
13.28%
19.89%
9.78%
16.73%
6.94%
14.55%
3.54%
2020
13.63%
26.55%
25.99%
17.49%
22.44%
13.13%
20.30%
9.51%
17.06%
6.54%
14.82%
3.11%
Source: IRS, Statistics of Income, Individual Income Rates and Tax Shares
Table 4.1. All Individual Returns Excluding Dependents: Number of Returns, Shares of Adjusted Gross Income (AGI) and Total Income Tax, AGI Floor on Percentiles in Current and Constant Dollars, and Average Tax Rates, by Selected Expanded Descending Cumulative Percentiles of Returns Based on Income Size Using the Definition of AGI for Each Year, Tax Years 2001-2019
[All figures are estimates based on samples]
Total
Descending cumulative percentiles
Top 0.001 percent
Top 0.01 percent
Top 0.1 percent
Top 1 percent
Top 2 percent
Top 3 percent
Top 4 percent
Top 5 percent
Top 10 percent
Top 20 percent
Top 25 percent
Top 30 percent
Top 40 percent
Top 50 percent
Number of returns:
2001
119,370,886
1,194
11,937
119,371
1,193,709
2,387,418
3,581,127
4,774,835
5,968,544
11,937,089
23,874,177
29,842,722
35,811,266
47,748,354
59,685,443
2002
119,850,561
1,199
11,985
119,851
1,198,506
2,397,011
3,595,517
4,794,022
5,992,528
11,985,056
23,970,112
29,962,640
35,955,168
47,940,224
59,925,281
2003
120,758,947
1,208
12,076
120,759
1,207,589
2,415,179
3,622,768
4,830,358
6,037,947
12,075,895
24,151,789
30,189,737
36,227,684
48,303,579
60,379,474
2004
122,509,974
1,225
12,251
122,510
1,225,100
2,450,199
3,675,299
4,900,399
6,125,499
12,250,997
24,501,995
30,627,494
36,752,992
49,003,990
61,254,987
2005
124,673,055
1,247
12,467
124,673
1,246,731
2,493,461
3,740,192
4,986,922
6,233,653
12,467,306
24,934,611
31,168,264
37,401,917
49,869,222
62,336,528
2006
128,441,165
1,284
12,844
128,441
1,284,412
2,568,823
3,853,235
5,137,647
6,422,058
12,844,117
25,688,233
32,110,291
38,532,350
51,376,466
64,220,583
2007
[4] 132,654,911
1,327
13,265
132,654
1,326,549
2,653,098
3,979,647
5,306,196
6,632,746
13,265,491
26,530,982
33,163,728
39,796,473
53,061,964
66,327,456
2008
132,891,770
1,329
13,289
132,892
1,328,918
2,657,835
3,986,753
5,315,671
6,644,589
13,289,177
26,578,354
33,222,943
39,867,531
53,156,708
66,445,885
2009
132,619,936
1,326
13,262
132,620
1,326,199
2,652,399
3,978,598
5,304,797
6,630,997
13,261,994
26,523,987
33,154,984
39,785,981
53,047,974
66,309,968
2010
135,033,492
1,350
13,503
135,033
1,350,335
2,700,670
4,051,005
5,401,340
6,751,675
13,503,349
27,006,698
33,758,373
40,510,048
54,013,397
67,516,746
2011
136,585,712
1,366
13,659
136,586
1,365,857
2,731,714
4,097,571
5,463,428
6,829,286
13,658,571
27,317,142
34,146,428
40,975,714
54,634,285
68,292,856
2012
136,080,353
1,361
13,608
136,080
1,360,804
2,721,607
4,082,411
5,443,214
6,804,018
13,608,035
27,216,071
34,020,088
40,824,106
54,432,141
68,040,177
2013
138,313,155
1,383
13,831
138,313
1,383,132
2,766,263
4,149,395
5,532,526
6,915,658
13,831,316
27,662,631
34,578,289
41,493,947
55,325,262
69,156,578
2014
139,562,034
1,396
13,956
139,562
1,395,620
2,791,241
4,186,861
5,582,481
6,978,102
13,956,203
27,912,407
34,890,509
41,868,610
55,824,814
69,781,017
2015
141,204,625
1,412
14,120
141,205
1,412,046
2,824,093
4,236,139
5,648,185
7,060,231
14,120,463
28,240,925
35,301,156
42,361,388
56,481,850
70,602,313
2016
140,888,785
1,409
14,089
140,889
1,408,888
2,817,776
4,226,664
5,635,551
7,044,439
14,088,879
28,177,757
35,222,196
42,266,636
56,355,514
70,444,393
2017
143,295,160
1,433
14,330
143,295
1,432,952
2,865,903
4,298,855
5,731,806
7,164,758
14,329,516
28,659,032
35,823,790
42,988,548
57,318,064
71,647,580
2018
144,317,866
1,443
14,432
144,318
1,443,179
2,886,357
4,329,536
5,772,715
7,215,893
14,431,787
28,863,573
36,079,467
43,295,360
57,727,146
72,158,933
2019
148,245,929
1,482
14,825
148,246
1,482,459
2,964,919
4,447,378
5,929,837
7,412,296
14,824,593
29,649,186
37,061,482
44,473,779
59,298,372
74,122,965
2020
157,494,242
1,575
15,749
157,494
1,574,942
3,149,885
4,724,827
6,299,770
7,874,712
15,749,424
31,498,848
39,373,561
47,248,273
62,997,697
78,747,121
Adjusted gross income floor on percentiles (current dollars):
2001
N/A
31,331,335
6,869,952
1,393,718
306,635
207,592
167,788
145,667
132,082
96,151
67,818
59,026
51,863
40,293
31,418
2002
N/A
25,921,482
5,891,214
1,245,352
296,194
200,654
164,409
144,575
130,750
95,699
67,928
59,066
51,721
40,073
31,299
2003
N/A
28,489,160
6,386,149
1,317,088
305,939
205,565
168,248
147,132
133,741
97,470
69,304
59,896
52,353
40,383
31,447
2004
N/A
38,780,500
8,455,107
1,617,918
339,993
224,320
181,127
156,665
140,758
101,838
72,069
62,794
54,765
42,081
32,622
2005
N/A
50,796,495
10,738,867
1,938,175
379,261
245,392
194,726
167,281
149,216
106,864
74,790
64,821
56,583
43,361
33,484
2006
N/A
54,665,360
11,649,460
2,124,625
402,603
258,800
205,835
176,455
157,390
112,016
77,776
67,291
58,505
44,748
34,417
2007
N/A
62,955,875
12,747,384
2,251,017
426,439
270,440
214,832
184,473
164,883
116,396
80,723
69,559
60,617
46,200
35,541
2008
N/A
49,546,782
10,097,827
1,867,652
392,513
260,381
209,750
181,624
163,512
116,813
80,886
69,813
60,535
46,120
35,340
2009
N/A
34,381,494
7,206,540
1,469,393
351,968
243,096
198,731
174,432
157,342
114,181
79,237
68,216
58,876
44,529
34,156
2010
N/A
45,039,369
8,762,618
1,634,386
369,691
252,785
205,942
179,023
161,579
116,623
80,462
69,126
59,512
44,895
34,338
2011
N/A
41,965,258
8,830,028
1,717,675
388,905
262,933
213,441
185,812
167,728
120,136
82,241
70,492
60,789
45,722
34,823
2012
N/A
62,068,187
12,104,014
2,161,175
434,682
285,908
227,923
196,416
175,817
125,195
85,440
73,354
63,222
47,475
36,055
2013
N/A
45,097,112
9,460,540
1,860,848
428,713
287,018
231,507
200,472
179,760
127,695
87,434
74,955
64,650
48,463
36,841
2014
N/A
56,981,718
11,407,987
2,136,762
465,626
306,650
245,902
211,261
188,996
133,445
90,606
77,714
66,868
50,083
38,173
2015
N/A
59,380,503
11,930,649
2,220,264
480,930
316,913
253,979
218,911
195,778
138,031
93,212
79,655
68,632
51,571
39,275
2016
N/A
53,052,900
10,963,921
2,124,117
480,804
319,796
256,673
221,381
197,651
139,713
94,620
80,921
69,581
52,529
40,078
2017
N/A
63,430,119
12,899,070
2,374,937
515,371
339,478
271,182
232,955
208,053
145,135
97,870
83,682
72,268
54,672
41,740
2018
N/A
68,934,261
13,576,286
2,514,209
540,009
359,368
286,106
245,050
217,913
151,935
101,765
87,044
75,083
57,092
43,614
2019
N/A
60,658,598
12,623,539
2,458,432
546,434
364,693
291,384
249,320
221,572
154,589
103,012
87,917
75,991
57,685
44,269
2020
N/A
77,008,517
14,757,246
2,614,565
548,336
366,358
290,860
248,513
220,521
152,321
100,723
85,853
73,572
55,213
42,184
Adjusted gross income floor on percentiles (constant dollars): [1]
2001
N/A
23,122,756
5,070,075
1,028,574
226,299
153,204
123,829
107,503
97,477
70,960
50,050
43,562
38,275
29,737
23,187
2002
N/A
18,838,286
4,281,406
905,052
215,257
145,824
119,483
105,069
95,022
69,549
49,366
42,926
37,588
29,123
22,746
2003
N/A
20,233,778
4,535,617
935,432
217,286
145,998
119,494
104,497
94,987
69,226
49,222
42,540
37,183
28,681
22,335
2004
N/A
26,837,716
5,851,285
1,119,666
235,289
155,239
125,347
108,419
97,410
70,476
49,875
43,456
37,900
29,122
22,576
2005
N/A
34,000,331
7,187,997
1,297,306
253,856
164,252
130,339
111,969
99,877
71,529
50,060
43,388
37,873
29,023
22,412
2006
N/A
35,450,947
7,554,773
1,377,837
261,091
167,834
133,486
114,433
102,069
72,643
50,438
43,639
37,941
29,019
22,320
2007
N/A
39,694,751
8,037,443
1,419,305
268,877
170,517
135,455
116,313
103,962
73,390
50,897
43,858
38,220
29,130
22,409
2008
N/A
30,083,049
6,131,043
1,133,972
238,320
158,094
127,353
110,276
99,279
70,925
49,111
42,388
36,755
28,002
21,457
2009
N/A
20,951,550
4,391,554
895,425
214,484
148,139
121,104
106,296
95,882
69,580
48,286
41,570
35,878
27,135
20,814
2010
N/A
27,002,020
5,253,368
979,848
221,637
151,550
123,466
107,328
96,870
69,918
48,239
41,442
35,679
26,915
20,586
2011
N/A
24,384,229
5,130,754
998,068
225,976
152,779
124,021
107,967
97,460
69,806
47,787
40,960
35,322
26,567
20,234
2012
N/A
35,346,348
6,892,946
1,230,737
247,541
162,818
129,797
111,854
100,124
71,296
48,656
41,773
36,003
27,036
20,532
2013
N/A
25,301,633
5,307,815
1,044,025
240,528
161,031
129,886
112,474
100,854
71,643
49,055
42,053
36,272
27,190
20,670
2014
N/A
31,464,229
6,299,275
1,179,880
257,110
169,326
135,782
116,654
104,360
73,686
50,031
42,912
36,923
27,655
21,078
2015
N/A
32,752,622
6,580,612
1,224,635
265,268
174,800
140,088
120,745
107,986
76,134
51,413
43,935
37,855
28,445
21,663
2016
N/A
28,895,915
5,971,635
1,156,926
261,876
174,181
139,800
120,578
107,653
76,096
51,536
44,075
37,898
28,611
21,829
2017
N/A
33,829,397
6,879,504
1,266,633
274,865
181,055
144,630
124,243
110,962
77,405
52,197
44,630
38,543
29,158
22,261
2018
N/A
35,884,571
7,067,301
1,308,802
281,108
187,073
148,936
127,564
113,437
79,092
52,975
45,312
39,085
29,720
22,704
2019
N/A
31,011,553
6,453,752
1,256,867
279,363
186,448
148,969
127,464
113,278
79,033
52,665
44,947
38,850
29,491
22,632
2020
N/A
38,893,190
7,453,155
1,320,487
276,937
185,029
146,899
125,512
111,374
76,930
50,870
43,360
37,158
27,885
21,305
Adjusted gross income (millions of dollars):
2001
6,116,274
84,705
216,684
492,437
1,064,928
1,360,872
1,582,562
1,768,355
1,933,563
2,599,650
3,555,692
3,933,186
4,263,535
4,810,102
5,235,273
2002
5,982,260
68,565
179,420
420,987
960,352
1,247,308
1,463,587
1,647,849
1,812,094
2,472,326
3,431,568
3,811,534
4,143,048
4,689,683
5,114,828
2003
6,156,994
83,238
206,010
465,594
1,030,178
1,327,075
1,549,825
1,738,945
1,907,837
2,586,777
3,572,674
3,961,657
4,300,174
4,855,774
5,286,949
2004
6,734,554
111,932
280,449
615,494
1,278,879
1,610,803
1,855,778
2,061,398
2,243,098
2,968,169
4,010,897
4,423,150
4,782,507
5,371,578
5,826,206
2005
7,365,689
143,370
362,581
783,762
1,560,659
1,932,055
2,202,354
2,426,492
2,623,077
3,400,596
4,506,197
4,940,249
5,317,903
5,936,944
6,412,897
2006
7,969,813
170,567
418,573
895,044
1,761,119
2,166,188
2,460,559
2,704,549
2,918,422
3,759,733
4,947,104
5,412,038
5,815,385
6,474,937
6,980,130
2007
8,621,963
219,494
503,678
1,030,091
1,971,021
2,411,916
2,729,468
2,992,467
3,223,396
4,128,240
5,401,825
5,898,437
6,329,354
7,032,507
7,571,084
2008
8,206,158
173,257
397,957
825,898
1,656,771
2,072,196
2,380,698
2,639,100
2,867,730
3,772,889
5,055,298
5,554,583
5,986,923
6,690,342
7,228,036
2009
7,578,641
126,242
281,687
601,504
1,304,627
1,684,139
1,973,637
2,219,853
2,439,146
3,317,402
4,570,256
5,057,761
5,478,063
6,159,780
6,678,194
2010
8,039,779
166,727
366,563
742,989
1,517,146
1,922,058
2,228,360
2,486,918
2,716,199
3,631,364
4,927,262
5,430,952
5,864,278
6,564,169
7,095,680
2011
8,317,188
144,984
342,338
737,251
1,555,701
1,984,960
2,306,674
2,578,137
2,818,879
3,774,978
5,120,188
5,640,585
6,088,552
6,810,489
7,356,627
2012
9,041,744
219,067
501,374
1,017,057
1,976,738
2,446,464
2,791,205
3,078,337
3,330,944
4,327,899
5,722,980
6,261,677
6,725,553
7,473,507
8,037,800
2013
9,033,840
168,992
384,881
815,662
1,719,794
2,195,723
2,550,046
2,847,179
3,109,388
4,143,498
5,591,750
6,151,678
6,633,611
7,409,491
7,995,603
2014
9,708,663
207,145
475,714
986,078
1,997,819
2,514,973
2,895,712
3,212,471
3,490,867
4,583,416
6,104,146
6,690,287
7,193,799
8,002,581
8,614,544
2015
10,142,620
214,647
495,201
1,033,473
2,094,906
2,636,987
3,034,889
3,366,920
3,658,556
4,803,327
6,389,094
6,997,737
7,519,683
8,360,826
8,998,075
2016
10,156,612
204,934
460,894
966,465
2,003,066
2,544,904
2,946,100
3,280,595
3,574,828
4,729,405
6,333,469
6,950,051
7,479,129
8,331,664
8,979,705
2017
10,936,500
256,250
565,453
1,150,471
2,301,449
2,889,391
3,321,003
3,680,328
3,995,037
5,220,949
6,913,130
7,561,368
8,118,508
9,019,611
9,706,054
2018
11,563,883
241,954
570,189
1,196,670
2,420,025
3,044,552
3,503,876
3,884,856
4,217,996
5,511,117
7,289,834
7,969,121
8,552,653
9,499,838
10,221,814
2019
11,882,850
214,487
522,449
1,140,517
2,393,383
3,042,810
3,523,664
3,921,774
4,269,727
5,621,027
7,472,188
8,177,266
8,783,586
9,766,007
10,517,131
2020
12,533,102
298,180
693,109
1,419,047
2,780,754
3,474,592
3,985,645
4,407,989
4,775,995
6,198,022
8,130,111
8,862,578
9,488,648
10,494,409
11,257,092
Total income tax (millions of dollars): [2]
2001
884,931
20,363
57,329
138,735
293,968
358,761
401,189
434,411
462,288
563,525
681,732
721,756
755,307
807,098
841,587
2002
794,282
16,728
48,388
119,894
262,820
323,052
362,355
393,407
419,871
513,320
620,746
656,602
687,111
731,873
760,808
2003
745,514
17,169
47,192
114,559
251,146
308,878
345,930
374,786
399,176
483,792
582,130
617,015
645,885
688,113
715,163
2004
829,096
21,437
59,739
141,937
300,802
367,392
409,259
440,979
467,165
558,007
659,803
694,983
724,830
769,074
797,040
2005
931,693
27,171
75,151
176,152
361,264
437,452
485,042
520,483
549,068
647,115
755,252
792,545
823,488
869,272
898,262
2006
1,020,438
30,860
83,499
196,358
401,610
485,109
536,823
575,603
607,088
715,108
832,153
872,385
905,569
954,823
985,657
2007
1,111,872
38,587
97,979
220,636
442,633
534,150
590,292
631,830
666,021
782,903
909,392
952,964
988,633
1,041,166
1,074,502
2008
1,028,669
33,136
83,085
187,200
385,857
470,285
523,500
563,684
597,246
711,873
837,561
880,244
915,035
965,691
996,815
2009
863,486
26,328
64,253
146,030
313,826
387,828
435,662
472,299
502,274
603,504
712,700
749,022
777,801
818,789
842,286
2010
949,144
31,453
76,390
169,734
354,810
436,043
488,303
528,045
560,649
670,319
787,407
826,796
858,000
901,560
926,782
2011
1,042,571
26,488
70,545
168,222
365,518
453,679
510,000
553,220
588,967
711,663
846,579
892,616
929,529
981,800
1,012,460
2012
1,184,978
38,563
97,902
220,414
451,328
550,934
613,192
660,121
698,543
831,445
975,377
1,024,046
1,063,388
1,119,368
1,152,063
2013
1,231,911
40,764
100,868
227,623
465,705
567,786
631,900
680,817
721,242
859,863
1,011,220
1,062,798
1,104,510
1,163,238
1,197,603
2014
1,374,379
49,740
123,288
272,826
542,640
656,229
727,556
780,687
824,153
974,124
1,137,716
1,192,679
1,236,678
1,299,383
1,336,637
2015
1,454,325
51,375
127,236
283,577
567,697
688,137
763,764
820,335
866,447
1,026,601
1,201,501
1,259,698
1,306,271
1,373,073
1,413,200
2016
1,442,385
46,845
115,384
261,423
538,257
658,950
735,763
793,331
839,898
1,002,072
1,180,713
1,240,010
1,288,231
1,356,952
1,398,523
2017
1,601,309
61,750
143,024
309,765
615,979
748,944
833,142
895,962
946,954
1,122,158
1,314,957
1,378,757
1,430,369
1,505,513
1,551,537
2018
1,536,178
55,455
139,455
310,631
615,716
737,900
815,821
876,470
926,367
1,096,343
1,279,036
1,336,041
1,382,868
1,450,202
1,491,041
2019
1,578,661
49,185
128,817
297,920
612,027
739,896
822,470
886,070
938,429
1,117,856
1,308,416
1,367,843
1,416,809
1,487,163
1,530,288
2020
1,708,081
70,771
174,466
376,728
722,732
860,441
948,113
1,016,226
1,071,681
1,258,335
1,450,659
1,511,786
1,560,458
1,628,375
1,668,410
Average tax rate (percentage): [3]
2001
14.47
24.04
26.46
28.17
27.60
26.36
25.35
24.57
23.91
21.68
19.17
18.35
17.72
16.78
16.08
2002
13.28
24.40
26.97
28.48
27.37
25.90
24.76
23.87
23.17
20.76
18.09
17.23
16.58
15.61
14.87
2003
12.11
20.63
22.91
24.60
24.38
23.28
22.32
21.55
20.92
18.70
16.29
15.57
15.02
14.17
13.53
2004
12.31
19.15
21.30
23.06
23.52
22.81
22.05
21.39
20.83
18.80
16.45
15.71
15.16
14.32
13.68
2005
12.65
18.95
20.73
22.48
23.15
22.64
22.02
21.45
20.93
19.03
16.76
16.04
15.49
14.64
14.01
2006
12.80
18.09
19.95
21.94
22.80
22.39
21.82
21.28
20.80
19.02
16.82
16.12
15.57
14.75
14.12
2007
12.90
17.58
19.45
21.42
22.46
22.15
21.63
21.11
20.66
18.96
16.83
16.16
15.62
14.81
14.19
2008
12.54
19.13
20.88
22.67
23.29
22.70
21.99
21.36
20.83
18.87
16.57
15.85
15.28
14.43
13.79
2009
11.39
20.86
22.81
24.28
24.05
23.03
22.07
21.28
20.59
18.19
15.59
14.81
14.20
13.29
12.61
2010
11.81
18.87
20.84
22.84
23.39
22.69
21.91
21.23
20.64
18.46
15.98
15.22
14.63
13.73
13.06
2011
12.54
18.27
20.61
22.82
23.50
22.86
22.11
21.46
20.89
18.85
16.53
15.82
15.27
14.42
13.76
2012
13.11
17.60
19.53
21.67
22.83
22.52
21.97
21.44
20.97
19.21
17.04
16.35
15.81
14.98
14.33
2013
13.64
24.12
26.21
27.91
27.08
25.86
24.78
23.91
23.20
20.75
18.08
17.28
16.65
15.70
14.98
2014
14.16
24.01
25.92
27.67
27.16
26.09
25.13
24.30
23.61
21.25
18.64
17.83
17.19
16.24
15.52
2015
14.34
23.93
25.69
27.44
27.10
26.10
25.17
24.36
23.68
21.37
18.81
18.00
17.37
16.42
15.71
2016
14.20
22.86
25.03
27.05
26.87
25.89
24.97
24.18
23.49
21.19
18.64
17.84
17.22
16.29
15.57
2017
14.64
24.10
25.29
26.93
26.76
25.92
25.09
24.34
23.70
21.49
19.02
18.23
17.62
16.69
15.99
2018
13.28
22.92
24.46
25.96
25.44
24.24
23.28
22.56
21.96
19.89
17.55
16.77
16.17
15.27
14.59
2019
13.29
22.93
24.66
26.12
25.57
24.32
23.34
22.59
21.98
19.89
17.51
16.73
16.13
15.23
14.55
2020
13.63
23.73
25.17
26.55
25.99
24.76
23.79
23.05
22.44
20.30
17.84
17.06
16.45
15.52
14.82
Adjusted gross income share (percentage):
2001
100.00
1.38
3.54
8.05
17.41
22.25
25.87
28.91
31.61
42.50
58.13
64.31
69.71
78.64
85.60
2002
100.00
1.15
3.00
7.04
16.05
20.85
24.47
27.55
30.29
41.33
57.36
63.71
69.26
78.39
85.50
2003
100.00
1.35
3.35
7.56
16.73
21.55
25.17
28.24
30.99
42.01
58.03
64.34
69.84
78.87
85.87
2004
100.00
1.66
4.16
9.14
18.99
23.92
27.56
30.61
33.31
44.07
59.56
65.68
71.01
79.76
86.51
2005
100.00
1.95
4.92
10.64
21.19
26.23
29.90
32.94
35.61
46.17
61.18
67.07
72.20
80.60
87.06
2006
100.00
2.14
5.25
11.23
22.10
27.18
30.87
33.93
36.62
47.17
62.07
67.91
72.97
81.24
87.58
2007
100.00
2.55
5.84
11.95
22.86
27.97
31.66
34.71
37.39
47.88
62.65
68.41
73.41
81.57
87.81
2008
100.00
2.11
4.85
10.06
20.19
25.25
29.01
32.16
34.95
45.98
61.60
67.69
72.96
81.53
88.08
2009
100.00
1.67
3.72
7.94
17.21
22.22
26.04
29.29
32.18
43.77
60.30
66.74
72.28
81.28
88.12
2010
100.00
2.07
4.56
9.24
18.87
23.91
27.72
30.93
33.78
45.17
61.29
67.55
72.94
81.65
88.26
2011
100.00
1.74
4.12
8.86
18.70
23.87
27.73
31.00
33.89
45.39
61.56
67.82
73.20
81.88
88.45
2012
100.00
2.42
5.55
11.25
21.86
27.06
30.87
34.05
36.84
47.87
63.30
69.25
74.38
82.66
88.90
2013
100.00
1.87
4.26
9.03
19.04
24.31
28.23
31.52
34.42
45.87
61.90
68.10
73.43
82.02
88.51
2014
100.00
2.13
4.90
10.16
20.58
25.90
29.83
33.09
35.96
47.21
62.87
68.91
74.10
82.43
88.73
2015
100.00
2.12
4.88
10.19
20.65
26.00
29.92
33.20
36.07
47.36
62.99
68.99
74.14
82.43
88.72
2016
100.00
2.02
4.54
9.52
19.72
25.06
29.01
32.30
35.20
46.56
62.36
68.43
73.64
82.03
88.41
2017
100.00
2.34
5.17
10.52
21.04
26.42
30.37
33.65
36.53
47.74
63.21
69.14
74.23
82.47
88.75
2018
100.00
2.09
4.93
10.35
20.93
26.33
30.30
33.59
36.48
47.66
63.04
68.91
73.96
82.15
88.39
2019
100.00
1.81
4.40
9.60
20.14
25.61
29.65
33.00
35.93
47.30
62.88
68.82
73.92
82.19
88.51
2020
100.00
2.38
5.53
11.32
22.19
27.72
31.80
35.17
38.11
49.45
64.87
70.71
75.71
83.73
89.82
Total income tax share (percentage):
2001
100.00
2.30
6.48
15.68
33.22
40.54
45.34
49.09
52.24
63.68
77.04
81.56
85.35
91.20
95.10
2002
100.00
2.11
6.09
15.09
33.09
40.67
45.62
49.53
52.86
64.63
78.15
82.67
86.51
92.14
95.79
2003
100.00
2.30
6.33
15.37
33.69
41.43
46.40
50.27
53.54
64.89
78.08
82.76
86.64
92.30
95.93
2004
100.00
2.59
7.21
17.12
36.28
44.31
49.36
53.19
56.35
67.30
79.58
83.82
87.42
92.76
96.13
2005
100.00
2.92
8.07
18.91
38.78
46.95
52.06
55.86
58.93
69.46
81.06
85.07
88.39
93.30
96.41
2006
100.00
3.02
8.18
19.24
39.36
47.54
52.61
56.41
59.49
70.08
81.55
85.49
88.74
93.57
96.59
2007
100.00
3.47
8.81
19.84
39.81
48.04
53.09
56.83
59.90
70.41
81.79
85.71
88.92
93.64
96.64
2008
100.00
3.22
8.08
18.20
37.51
45.72
50.89
54.80
58.06
69.20
81.42
85.57
88.95
93.88
96.90
2009
100.00
3.05
7.44
16.91
36.34
44.91
50.45
54.70
58.17
69.89
82.54
86.74
90.08
94.82
97.54
2010
100.00
3.31
8.05
17.88
37.38
45.94
51.45
55.63
59.07
70.62
82.96
87.11
90.40
94.99
97.64
2011
100.00
2.54
6.77
16.14
35.06
43.52
48.92
53.06
56.49
68.26
81.20
85.62
89.16
94.17
97.11
2012
100.00
3.25
8.26
18.60
38.09
46.49
51.75
55.71
58.95
70.17
82.31
86.42
89.74
94.46
97.22
2013
100.00
3.31
8.19
18.48
37.80
46.09
51.29
55.27
58.55
69.80
82.09
86.27
89.66
94.43
97.22
2014
100.00
3.62
8.97
19.85
39.48
47.75
52.94
56.80
59.97
70.88
82.78
86.78
89.98
94.54
97.25
2015
100.00
3.53
8.75
19.50
39.04
47.32
52.52
56.41
59.58
70.59
82.62
86.62
89.82
94.41
97.17
2016
100.00
3.25
8.00
18.12
37.32
45.68
51.01
55.00
58.23
69.47
81.86
85.97
89.31
94.08
96.96
2017
100.00
3.86
8.93
19.34
38.47
46.77
52.03
55.95
59.14
70.08
82.12
86.10
89.33
94.02
96.89
2018
100.00
3.61
9.08
20.22
40.08
48.03
53.11
57.06
60.30
71.37
83.26
86.97
90.02
94.40
97.06
2019
100.00
3.12
8.16
18.87
38.77
46.87
52.10
56.13
59.44
70.81
82.88
86.65
89.75
94.20
96.94
2020
100.00
4.14
10.21
22.06
42.31
50.37
55.51
59.50
62.74
73.67
84.93
88.51
91.36
95.33
97.68
Notes: N/A– Not applicable.
[1] For Table 4.1, constant dollars were calculated using the U.S. Bureau of Labor Statistics’ consumer price index for urban consumers (CPI-U, 1990=100). For 2019 the CPI-U = 255.657.
[2] Total income tax was the sum of income tax after credits (including the subtraction of excess advance premium tax credit repayment, the earned income credit, American opportunity credit, health coverage tax credit, and the regulated investment credit credit) limited to zero plus net investment income tax from Form 8960 and the tax fromForm 4970, Tax on Accumulation Distribution of Trusts. It does not include any refundable portions of these credits.
[3] The average tax rate was computed by dividing total income tax (see footnote 2) by adjusted gross income.
[4] The total number of returns does not include the returns filed by individuals to only receive the economic stimulus payment and who had no other reason to file.
Source: IRS, Statistics of Income Division, Publication 1304, November 2021
Table 4.2. All Individual Returns Excluding Dependents: Number of Returns, Shares of Adjusted Gross Income (AGI) and Total Income Tax, and Average Tax Rates, by Selected Ascending Cumulative Percentiles of Returns Based on Income Size Using the Definition of AGI for Each Year, Tax Years 2001-2019
[All figures are estimates based on samples]
Item, tax year
Total
Ascending cumulative percentiles
Bottom 50 percent
Bottom 75 percent
Bottom 90 percent
Bottom 95 percent
Bottom 99 Percent
Number of returns:
2001
119,370,886
59,685,443
89,528,165
107,433,797
113,402,342
118,177,177
2002
119,850,561
59,925,281
89,887,921
107,865,505
113,858,033
118,652,055
2003
120,758,947
60,379,474
90,569,210
108,683,052
114,721,000
119,551,358
2004
122,509,974
61,254,987
91,882,481
110,258,977
116,384,475
121,284,874
2005
124,673,055
62,336,528
93,504,791
112,205,750
118,439,402
123,426,324
2006
128,441,165
64,220,583
96,330,874
115,597,049
122,019,107
127,156,753
2007
[3] 132,654,911
66,327,456
99,491,183
119,389,420
126,022,165
131,328,362
2008
132,891,770
66,445,885
99,668,828
119,602,593
126,247,182
131,562,852
2009
132,619,936
66,309,968
99,464,952
119,357,942
125,988,939
131,293,737
2010
135,033,492
67,516,746
101,275,119
121,530,143
128,281,817
133,683,157
2011
136,585,712
68,292,856
102,439,284
122,927,141
129,756,426
135,219,855
2012
136,080,353
68,040,177
102,060,265
122,472,318
129,276,335
134,719,549
2013
138,313,155
69,156,578
103,734,866
124,481,840
131,397,497
136,930,023
2014
139,562,034
69,781,017
104,671,526
125,605,831
132,583,932
138,166,414
2015
141,204,625
70,602,313
105,903,469
127,084,163
134,144,394
139,792,579
2016
140,888,785
70,444,393
105,666,589
126,799,907
133,844,346
139,479,897
2017
143,295,160
71,647,580
107,471,370
128,965,644
136,130,402
141,862,208
2018
144,317,866
72,158,933
108,238,400
129,886,079
137,101,973
142,874,687
2019
148,245,929
74,122,965
111,184,447
133,421,336
140,833,633
146,763,470
2020
157,494,242
78,747,121
118,120,682
141,744,818
149,619,530
155,919,300
Adjusted gross income (millions of dollars):
2001
6,116,274
881,001
2,183,088
3,516,624
4,182,711
5,051,346
2002
5,982,260
867,431
2,170,726
3,509,933
4,170,166
5,021,907
2003
6,156,994
870,045
2,195,336
3,570,217
4,249,157
5,126,816
2004
6,734,554
908,348
2,311,404
3,766,385
4,491,456
5,455,674
2005
7,365,689
952,792
2,425,440
3,965,094
4,742,612
5,805,030
2006
7,969,813
989,682
2,557,775
4,210,079
5,051,390
6,208,693
2007
8,621,963
1,050,879
2,723,525
4,493,722
5,398,566
6,650,942
2008
8,206,158
978,122
2,651,575
4,433,269
5,338,428
6,549,387
2009
7,578,641
900,447
2,520,880
4,261,239
5,139,495
6,274,014
2010
8,039,779
944,099
2,608,826
4,408,415
5,323,580
6,522,633
2011
8,317,188
960,561
2,676,602
4,542,210
5,498,309
6,761,487
2012
9,041,744
1,003,944
2,780,067
4,713,845
5,710,800
7,065,006
2013
9,033,840
1,038,237
2,882,162
4,890,343
5,924,452
7,314,046
2014
9,708,663
1,094,119
3,018,376
5,125,247
6,217,796
7,710,844
2015
10,142,620
1,144,545
3,144,883
5,339,293
6,484,064
8,047,714
2016
10,156,612
1,176,907
3,206,562
5,427,208
6,581,784
8,153,546
2017
10,936,500
1,230,446
3,375,132
5,715,551
6,941,463
8,635,051
2018
11,563,883
1,342,069
3,594,762
6,052,766
7,345,887
9,143,858
2019
11,882,850
1,365,719
3,705,584
6,261,823
7,613,122
9,489,467
2020
12,533,102
1,276,009
3,670,524
6,335,079
7,757,107
9,752,348
Total income tax (millions of dollars): [1]
2001
884,931
43,344
163,175
321,406
422,643
590,963
2002
794,282
33,474
137,679
280,962
374,411
531,462
2003
745,514
30,351
128,499
261,722
346,338
494,368
2004
829,096
32,054
134,114
271,089
361,932
528,294
2005
931,693
33,431
139,143
284,578
382,625
570,430
2006
1,020,438
34,781
148,053
305,330
413,350
618,828
2007
1,111,872
37,371
158,909
328,969
445,851
669,239
2008
1,028,669
31,857
148,425
316,797
431,423
642,812
2009
863,486
21,200
114,465
259,982
361,213
549,660
2010
949,144
22,363
122,347
278,824
388,495
594,333
2011
1,042,571
30,109
149,953
330,907
453,605
677,052
2012
1,184,978
32,915
160,934
353,533
486,435
733,650
2013
1,231,911
34,307
169,113
372,048
510,669
766,206
2014
1,374,379
37,740
181,700
400,255
550,226
831,738
2015
1,454,325
41,125
194,628
427,723
587,879
886,628
2016
1,442,385
43,863
202,378
440,313
602,487
904,128
2017
1,601,309
49,772
222,552
479,151
654,355
985,330
2018
1,536,178
45,137
200,137
439,835
609,811
920,462
2019
1,578,661
48,373
210,818
460,789
640,232
966,634
2020
1,708,081
39,671
196,295
449,746
636,400
985,349
Average tax rate (percentage): [2]
2001
14.47
4.92
7.47
9.14
10.10
11.70
2002
13.28
3.86
6.34
8.00
8.98
10.58
2003
12.11
3.49
5.85
7.33
8.15
9.64
2004
12.31
3.53
5.80
7.20
8.06
9.68
2005
12.65
3.51
5.74
7.18
8.07
9.83
2006
12.80
3.51
5.79
7.25
8.18
9.97
2007
12.90
3.56
5.83
7.32
8.26
10.06
2008
12.54
3.26
5.60
7.15
8.08
9.81
2009
11.39
2.35
4.54
6.10
7.03
8.76
2010
11.81
2.37
4.69
6.32
7.30
9.11
2011
12.54
3.13
5.60
7.29
8.25
10.01
2012
13.11
3.28
5.79
7.50
8.52
10.38
2013
13.64
3.30
5.87
7.61
8.62
10.48
2014
14.16
3.45
6.02
7.81
8.85
10.79
2015
14.34
3.59
6.19
8.01
9.07
11.02
2016
14.20
3.73
6.31
8.11
9.15
11.09
2017
14.64
4.05
6.59
8.38
9.43
11.41
2018
13.28
3.36
5.57
7.27
8.30
10.07
2019
13.29
3.54
5.69
7.36
8.41
10.19
2020
13.63
3.11
5.35
7.10
8.20
10.10
Adjusted gross income share (percentage):
2001
100.00
14.40
35.69
57.50
68.39
82.59
2002
100.00
14.50
36.29
58.67
69.71
83.95
2003
100.00
14.13
35.66
57.99
69.01
83.27
2004
100.00
13.49
34.32
55.93
66.69
81.01
2005
100.00
12.94
32.93
53.83
64.39
78.81
2006
100.00
12.42
32.09
52.83
63.38
77.90
2007
100.00
12.19
31.59
52.12
62.61
77.14
2008
100.00
11.92
32.31
54.02
65.05
79.81
2009
100.00
11.88
33.26
56.23
67.82
82.79
2010
100.00
11.74
32.45
54.83
66.22
81.13
2011
100.00
11.55
32.18
54.61
66.11
81.30
2012
100.00
11.10
30.75
52.13
63.16
78.14
2013
100.00
11.49
31.90
54.13
65.58
80.96
2014
100.00
11.27
31.09
52.79
64.04
79.42
2015
100.00
11.28
31.01
52.64
63.93
79.35
2016
100.00
11.59
31.57
53.44
64.80
80.28
2017
100.00
11.25
30.86
52.26
63.47
78.96
2018
100.00
11.61
31.09
52.34
63.52
79.07
2019
100.00
11.49
31.18
52.70
64.07
79.86
2020
100.00
10.18
29.29
50.55
61.89
77.81
Total income tax share (percentage):
2001
100.00
4.90
18.44
36.32
47.76
66.78
2002
100.00
4.21
17.33
35.37
47.14
66.91
2003
100.00
4.07
17.24
35.11
46.46
66.31
2004
100.00
3.87
16.18
32.70
43.65
63.72
2005
100.00
3.59
14.93
30.54
41.07
61.23
2006
100.00
3.41
14.51
29.92
40.51
60.64
2007
100.00
3.36
14.29
29.59
40.10
60.19
2008
100.00
3.10
14.43
30.80
41.94
62.49
2009
100.00
2.46
13.26
30.11
41.83
63.66
2010
100.00
2.36
12.89
29.38
40.93
62.62
2011
100.00
2.89
14.38
31.74
43.51
64.94
2012
100.00
2.78
13.58
29.83
41.05
61.91
2013
100.00
2.78
13.73
30.20
41.45
62.20
2014
100.00
2.75
13.22
29.12
40.03
60.52
2015
100.00
2.83
13.38
29.41
40.42
60.96
2016
100.00
3.04
14.03
30.53
41.77
62.68
2017
100.00
3.11
13.90
29.92
40.86
61.53
2018
100.00
2.94
13.03
28.63
39.70
59.92
2019
100.00
3.06
13.35
29.19
40.56
61.23
2020
100.00
2.32
11.49
26.33
37.26
57.69
N/A– Not applicable.
[1] Total income tax was the sum of income tax after credits (including the subtraction of excess advance premium tax credit repayment, the earned income credit, American opportunity credit, health coverage tax credit and the regulated investment credit credit) limited to zero plus net investment income tax from Form 8960 and the tax from Form 4970, Tax on Accumulation Distribution of Trusts.
[2] The average tax rate was computed by dividing total income tax (see footnote 1) by adjusted gross income.
[3] The total number of returns does not include the returns filed by individuals to only receive the economic stimulus payment and who had no other reason to file.
Source: IRS, Statistics of Income Division, Publication 1304, November 2021
[1] Internal Revenue Service, Statistics of Income, “Number of Returns, Shares of AGI and Total Income Tax, AGI Floor on Percentiles in Current and Constant Dollars, and Average Tax Rates,” Table 1, and “Number of Returns, Shares of AGI and Total Income Tax, and Average Tax Rates,” Table 2, https://www.irs.gov/statistics/soi-tax-stats-individual-income-tax-rates-and-tax-shares.
[2] The total number of returns in 2020 does not include the returns filed by individuals to only receive the economic stimulus payment and who had no other reason to file.
[3] Internal Revenue Service, “Exclusion of up to $10,200 of Unemployment Compensation for Tax Year 2020 Only,” https://www.irs.gov/forms-pubs/exclusion-of-up-to-10200-of-unemployment-compensation-for-tax-year-2020-only#:~:text=This%20means%20you%20don’t,each%20individual%20are%20still%20taxable.
[4] Internal Revenue Service, “Recovery Rebate Credit,” https://www.irs.gov/newsroom/recovery-rebate-credit.
[5] “Average income tax rate” is income taxes paid divided by adjusted gross income.


