
Article updated on December 3rd, 2025 by Bob CiuraSpreadsheet data updated daily
The Dividend Aristocrats are a select group of 69 S&P 500 stocks with 25+ years of consecutive dividend increases.
They are the ‘best of the best’ dividend growth stocks. The Dividend Aristocrats have a long history of outperforming the market.
The requirements to be a Dividend Aristocrat are:
Be in the S&P 500
Have 25+ consecutive years of dividend increases
Meet certain minimum size & liquidity requirements
There are currently 69 Dividend Aristocrats. You can download an Excel spreadsheet of all 69 (with metrics that matter such as dividend yields and price-to-earnings ratios) by clicking the link below:

Disclaimer: Sure Dividend is not affiliated with S&P Global in any way. S&P Global owns and maintains The Dividend Aristocrats Index. The information in this article and downloadable spreadsheet is based on Sure Dividend’s own review, summary, and analysis of the S&P 500 Dividend Aristocrats ETF (NOBL) and other sources, and is meant to help individual investors better understand this ETF and the index upon which it is based. None of the information in this article or spreadsheet is official data from S&P Global. Consult S&P Global for official information.
Note 1: On January 24th, 2025, Erie Indemnity (ERIE), Eversource Energy (ES), and FactSet Research System (FDS) were added to the list with no deletions, leaving 69 Dividend Aristocrats.
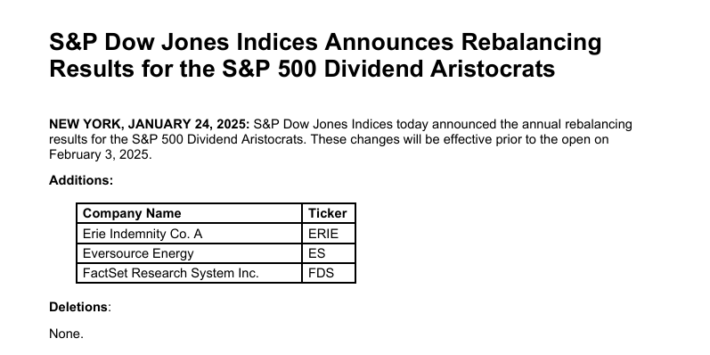
Source: S&P News Releases.
You can see detailed analysis on all 69 further below in this article, in our Dividend Aristocrats In Focus Series. Analysis includes valuation, growth, and competitive advantage(s).
Table of Contents
How to Use The Dividend Aristocrats List To Find Dividend Investment Ideas
The downloadable Dividend Aristocrats Excel Spreadsheet List above contains the following for each stock in the index:
Price-to-earnings ratio
Dividend yield
Market capitalization
All Dividend Aristocrats are high-quality businesses based on their long dividend histories. A company cannot pay rising dividends for 25+ years without having a strong and durable competitive advantage.
But not all Dividend Aristocrats make equally good investments today. That’s where the spreadsheet in this article comes into play. You can use the Dividend Aristocrats spreadsheet to quickly find quality dividend investment ideas.
The list of all Dividend Aristocrats is valuable because it gives you a concise list of all S&P 500 stocks with 25+ consecutive years of dividend increases (that also meet certain minimum size and liquidity requirements).
These are businesses that have both the desire and ability to pay shareholders rising dividends year-after-year. This is a rare combination.
Together, these two criteria are powerful – but they are not enough. Value must be considered as well.
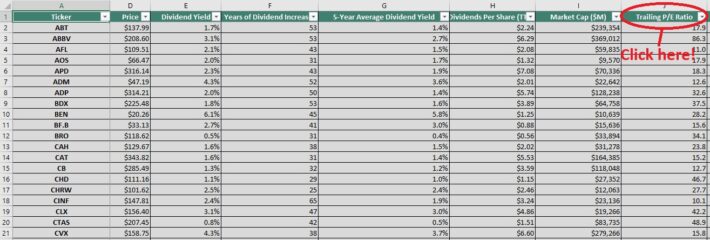
The spreadsheet above allows you to sort by trailing price-to-earnings ratio so you can quickly find undervalued, high-quality dividend stocks.
Here’s how to use the Dividend Aristocrats list to quickly find high-quality dividend growth stocks potentially trading at a discount:
Download the list
Sort by ‘Trailing PE Ratio,’ smallest to largest
Research the top stocks further
Here’s how to do this quickly in the spreadsheet:
Step 1: Download the list, and open it.
Step 2: Apply a filter function to each column in the spreadsheet.
Step 3: Click on the small gray down arrow next to ‘Trailing P/E Ratio’, and then sort smallest to largest.
Step 4: Review the highest ranked Dividend Aristocrats before investing. You can see detailed analysis on every Dividend Aristocrat found below in this article.
That’s it; you can follow the same procedure to sort by any other metric in the spreadsheet.
Performance Of The Dividend Aristocrats
In November 2025, the Dividend Aristocrats, as measured by the Dividend Aristocrats ETF (NOBL), registered a total return of 3.4%. It out-performed the SPDR S&P 500 ETF (SPY) for the month.
NOBL generated returns of 3.4% in November 2025
SPY generated returns of 0.2% in November 2025
Short-term performance is mostly noise. Performance should be measured over a minimum of 3 years, and preferably longer periods of time.
The Dividend Aristocrats Index has slightly under-performed the broader market index over the last decade, with a 10.4% total annual return for the Dividend Aristocrats and a 14.6% total annual return for the S&P 500 Index.
But the Dividend Aristocrats have exhibited lower risk than the benchmark, as measured by standard deviation.
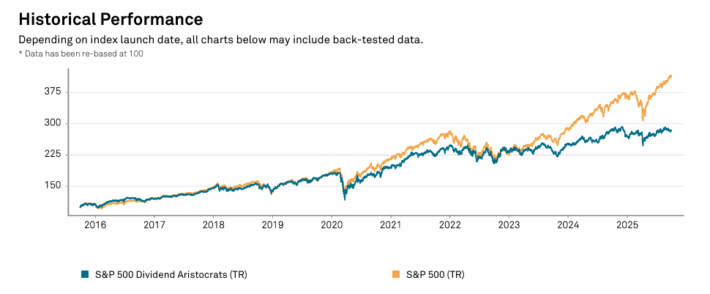
Source: S&P Fact Sheet
Higher total returns with lower volatility is the ‘holy grail’ of investing. It is worth exploring the characteristics of the Dividend Aristocrats in detail to determine why they have performed so well.
Note that a good portion of the outperformance relative to the S&P 500 comes during recessions (2000 – 2002, 2008). Dividend Aristocrats have historically seen smaller drawdowns during recessions versus the S&P 500. This makes holding through recessions that much easier.
Case-in-point: In 2008 the Dividend Aristocrats Index declined 22%. That same year, the S&P 500 declined 38%.
Great businesses with strong competitive advantages tend to be able to generate stronger cash flows during recessions. This allows them to gain market share while weaker businesses fight to stay alive.
The Dividend Aristocrats Index has beaten the market over the last 28 years…
We believe dividend paying stocks outperform non-dividend paying stocks for three reasons:
A company that pays dividends is likely to be generating earnings or cash flows so that it can pay dividends to shareholders. This excludes ‘pre-earnings’ start-ups and failing businesses. In short, it excludes the riskiest stocks.
A business that pays consistent dividends must be more selective with the growth projects it takes on because a portion of its cash flows are being paid out as dividends. Scrutinizing over capital allocation decisions likely adds to shareholder value.
Stocks that pay dividends are willing to reward shareholders with cash payments. This is a sign that management is shareholder friendly.
In our view, Dividend Aristocrats have historically outperformed the market and other dividend paying stocks because they are, on average, higher-quality businesses.
A high-quality business should outperform a mediocre business over a long period of time, all other things being equal.
For a business to increase its dividends for 25+ consecutive years, it must have or at least had in the very recent past a strong competitive advantage.
Sector Overview
A sector breakdown of the Dividend Aristocrats Index is shown below:

The Dividend Aristocrats Index is tilted toward Consumer Staples and Industrials relative to the S&P 500. These 2 sectors make up over 40% of the Dividend Aristocrats Index, but less than 20% of the S&P 500.
The Dividend Aristocrats Index is also significantly underweight the Information Technology sector, with a ~3% allocation compared with over 20% allocation within the S&P 500.
The Dividend Aristocrat Index is filled with stable ‘old economy’ blue chip consumer products businesses and manufacturers; the Coca-Cola’s (KO), and Johnson & Johnson’s (JNJ) of the investing world.
These ‘boring’ businesses aren’t likely to generate 20%+ earnings-per-share growth, but they also are very unlikely to see large earnings drawdowns as well.
The 10 Best Dividend Aristocrats Now
This research report examines the 10 best Dividend Aristocrats from our Sure Analysis Research Database with the highest 5-year forward expected total returns.
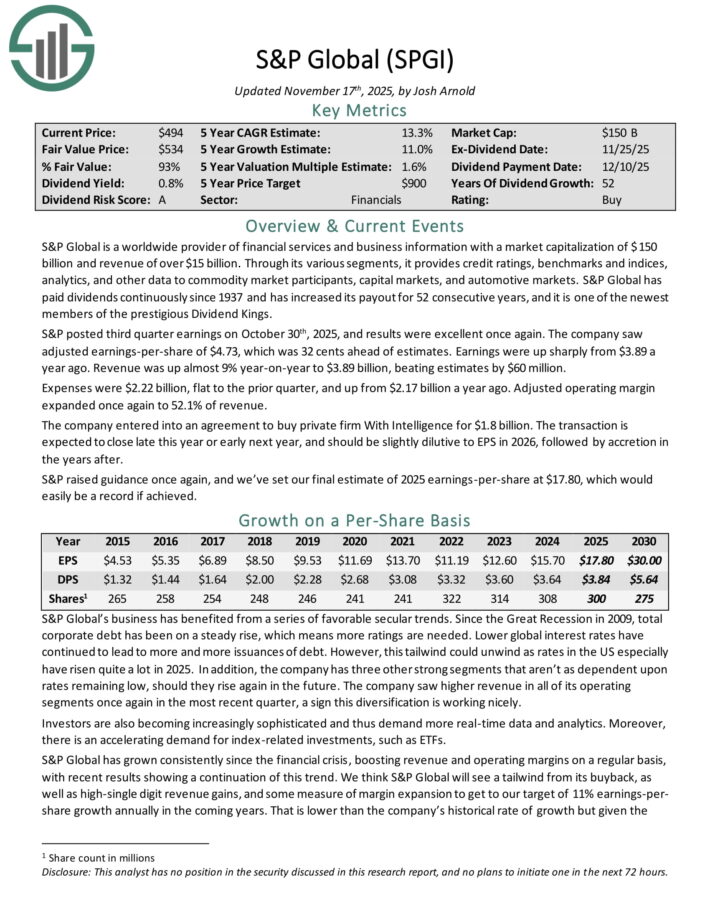
Dividend Aristocrat #10: S&P Global Inc. (SPGI)
5-year Expected Annual Returns: 13.4%
S&P Global is a worldwide provider of financial services and business information with revenue of over $15 billion. Through its various segments, it provides credit ratings, benchmarks and indices, analytics, and other data to commodity market participants, capital markets, and automotive markets.
S&P Global has paid dividends continuously since 1937 and has increased its payout for 52 consecutive years, and it is one of the newest members of the prestigious Dividend Kings.
S&P posted third quarter earnings on October 30th, 2025. The company saw adjusted earnings-per-share of $4.73, which was 32 cents ahead of estimates.
Earnings were up sharply from $3.89 a year ago. Revenue was up almost 9% year-on-year to $3.89 billion, beating estimates by $60 million.
Expenses were $2.22 billion, flat to the prior quarter, and up from $2.17 billion a year ago. Adjusted operating margin expanded once again to 52.1% of revenue.
The company entered into an agreement to buy private firm With Intelligence for $1.8 billion. The transaction is expected to close late this year or early next year, and should be slightly dilutive to EPS in 2026, followed by accretion in the years after.
Click here to download our most recent Sure Analysis report on SPGI (preview of page 1 of 3 shown below):
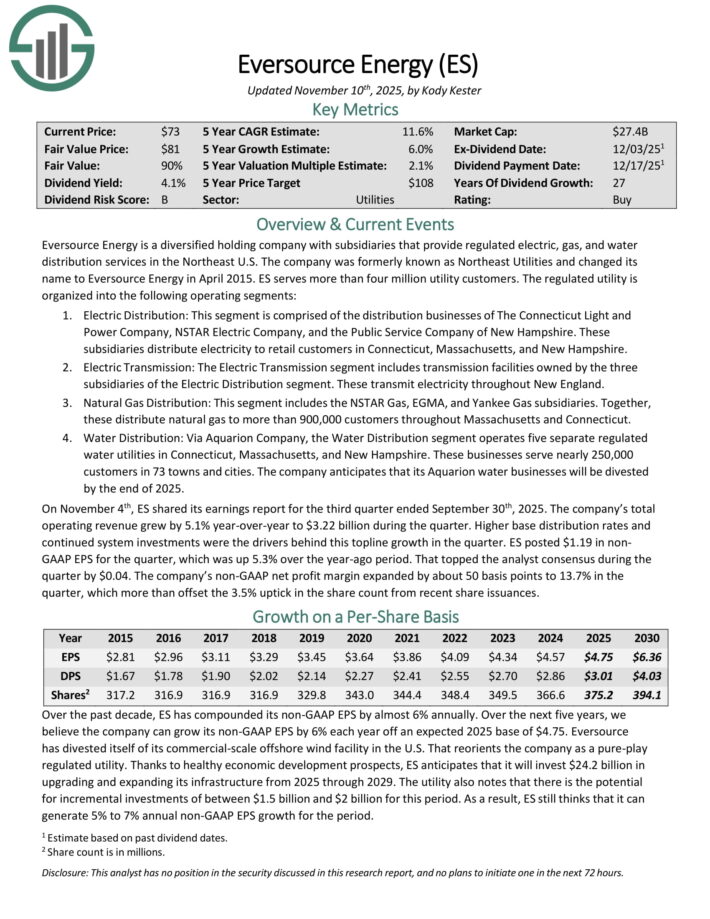
Dividend Aristocrat #9: Eversource Energy (ES)
5-year Expected Annual Returns: 13.7%
Eversource Energy is a diversified holding company with subsidiaries that provide regulated electric, gas, and water distribution services in the Northeast U.S.
ES serves more than four million utility customers. The regulated utility is organized into the following operating segments.
The Electric Distribution segment is comprised of the distribution businesses of The Connecticut Light and Power Company, NSTAR Electric Company, and the Public Service Company of New Hampshire. These subsidiaries distribute electricity to retail customers in Connecticut, Massachusetts, and New Hampshire.
The Electric Transmission segment includes transmission facilities owned by the three subsidiaries of the Electric Distribution segment. These transmit electricity throughout New England.
The Natural Gas Distribution segment includes the NSTAR Gas, EGMA, and Yankee Gas subsidiaries. Together, these distribute natural gas to more than 900,000 customers throughout Massachusetts and Connecticut.
Lastly, the Water Distribution segment operates five separate regulated water utilities in Connecticut, Massachusetts, and New Hampshire. These businesses serve nearly 250,000 customers in 73 towns and cities.
On November 4th, ES shared its earnings report for the third quarter ended September 30th, 2025. The company’s total operating revenue grew by 5.1% year-over-year to $3.22 billion during the quarter.
Higher base distribution rates and continued system investments were the drivers behind this topline growth in the quarter.
ES posted $1.19 in non-GAAP EPS for the quarter, which was up 5.3% over the year-ago period. That topped the analyst consensus during the quarter by $0.04.
Click here to download our most recent Sure Analysis report on ES (preview of page 1 of 3 shown below):
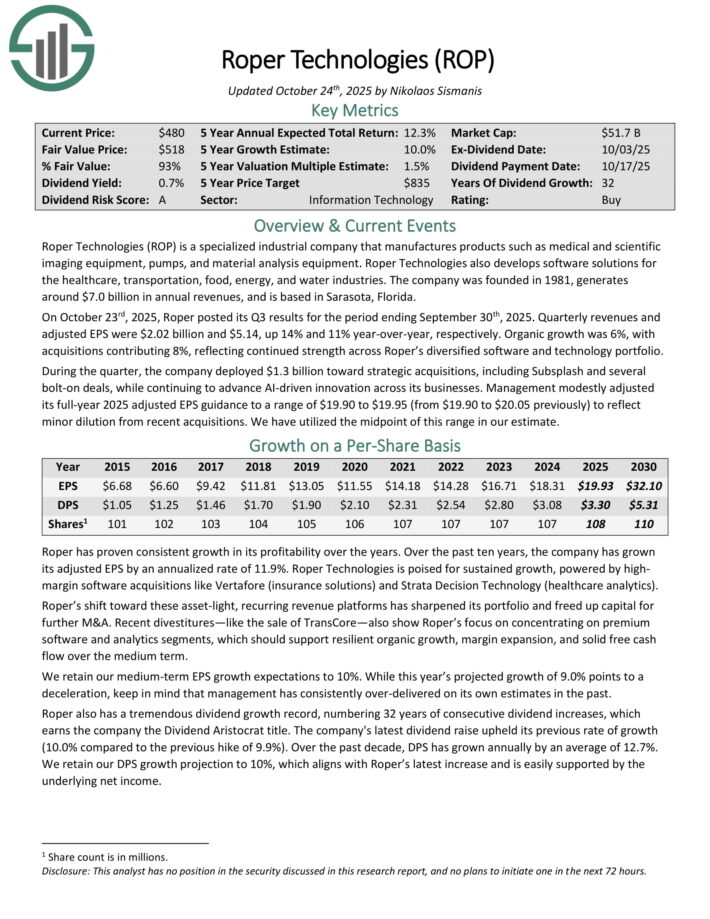
Dividend Aristocrat #8: Roper Technologies (ROP)
5-year Expected Annual Returns: 14.1%
Roper Technologies is a specialized industrial company that manufactures products such as medical and scientific imaging equipment, pumps, and material analysis equipment.
Roper Technologies also develops software solutions for the healthcare, transportation, food, energy, and water industries. The company was founded in 1981, generates around $7.0 billion in annual revenues, and is based in Sarasota, Florida.
On October 23rd, 2025, Roper posted its Q3 results for the period ending September 30th, 2025. Quarterly revenues and adjusted EPS were $2.02 billion and $5.14, up 14% and 11% year-over-year, respectively.
Organic growth was 6%, with acquisitions contributing 8%, reflecting continued strength across Roper’s diversified software and technology portfolio.
During the quarter, the company deployed $1.3 billion toward strategic acquisitions, including Subsplash and several bolt-on deals, while continuing to advance AI-driven innovation across its businesses.
Management modestly adjusted its full-year 2025 adjusted EPS guidance to a range of $19.90 to $19.95 (from $19.90 to $20.05 previously) to reflect minor dilution from recent acquisitions.
Click here to download our most recent Sure Analysis report on ROP (preview of page 1 of 3 shown below):
Dividend Aristocrat #7: PepsiCo Inc. (PEP)
5-year Expected Annual Returns: 14.7%
PepsiCo is a global food and beverage company that generates $89 billion in annual sales. The company’s products include Pepsi, Mountain Dew, Frito-Lay chips, Gatorade, Tropicana orange juice and Quaker foods.
The company has more than 20 $1 billion brands in its portfolio. On February 4th, 2025, PepsiCo increased its annualized dividend by 5.0% to $5.69 starting with the payment that was made in June 2025, extending the company’s dividend growth streak to 53 consecutive years.
On October 9th, 2025, PepsiCo reported third quarter earnings results for the period ending September 30th, 2025. For the quarter, revenue grew 2.7% to $23.9 billion, which beat estimates by $90 million. Adjusted earnings-per-share of $2.29 compared unfavorably to $2.31 the prior year, but this was $0.03 better than expected.
Organic sales grew 1.3% for the third quarter. For the period, volumes for both beverages and foods were down 1%. PepsiCo Beverages North America’s organic revenue grew 2% for the period even as volume declined by 3%.
Revenue for PepsiCo Foods North America decreased 3%, largely due to divestitures. Food volume decreased 4%. The International Beverages segment fell 1%, primarily due to lower volume. Revenues in Europe/Middle East/Africa were up 5.5%. Food volume declined 1%, but this was offset by a 1.5% gain in beverages.
PepsiCo reaffirmed prior guidance for 2025, with the company still expecting organic sales in the low single-digit range.
Click here to download our most recent Sure Analysis report on PEP (preview of page 1 of 3 shown below):

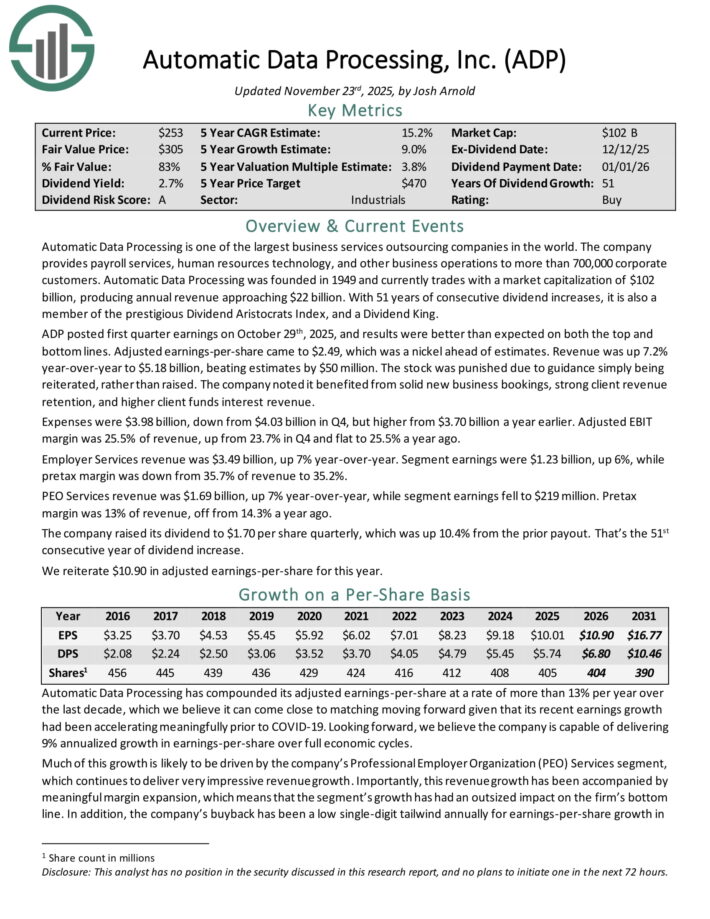
Dividend Aristocrat #6: Automatic Data Processing (ADP)
5-year Expected Annual Returns: 14.9%
Automatic Data Processing is one of the largest business services outsourcing companies in the world. The company provides payroll services, human resources technology, and other business operations to more than 700,000 corporate customers.
ADP posted first quarter earnings on October 29th, 2025, and results were better than expected on both the top and bottom lines. Adjusted earnings-per-share came to $2.49, which was a nickel ahead of estimates.
Revenue was up 7.2% year-over-year to $5.18 billion, beating estimates by $50 million. Expenses were $3.98 billion, down from $4.03 billion in Q4, but higher from $3.70 billion a year earlier.
Adjusted EBIT margin was 25.5% of revenue, up from 23.7% in Q4 and flat to 25.5% a year ago. Employer Services revenue was $3.49 billion, up 7% year-over-year. Segment earnings were $1.23 billion, up 6%, while pretax margin was down from 35.7% of revenue to 35.2%.
PEO Services revenue was $1.69 billion, up 7% year-over-year, while segment earnings fell to $219 million. Pretax margin was 13% of revenue, off from 14.3% a year ago.
The company raised its dividend to $1.70 per share quarterly, which was up 10.4% from the prior payout. That’s the 51st consecutive year of dividend increase.
Click here to download our most recent Sure Analysis report on ADP (preview of page 1 of 3 shown below):
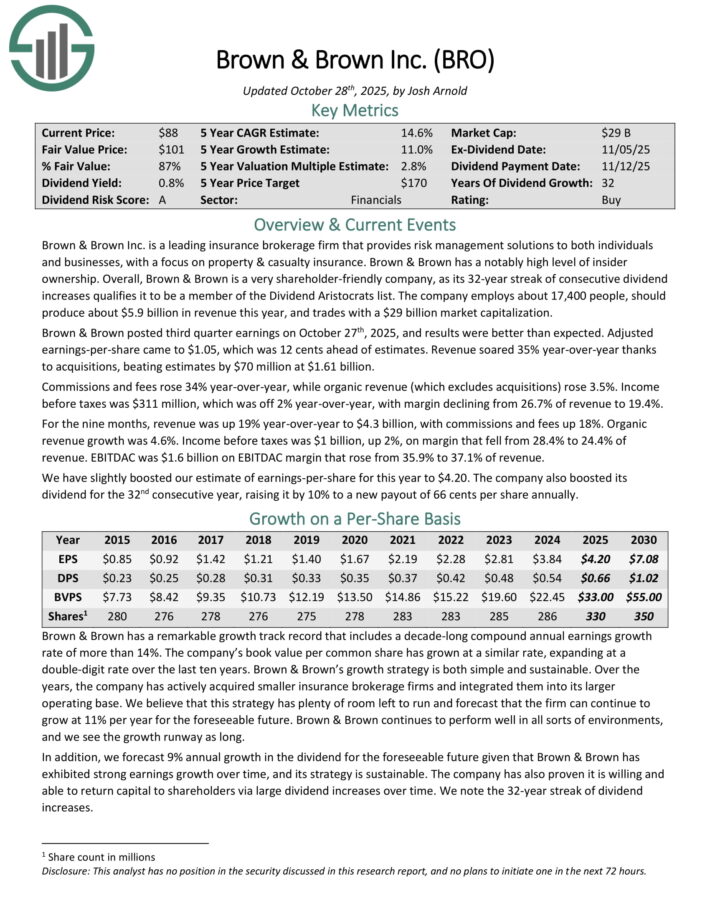
Dividend Aristocrat #5: Brown & Brown (BRO)
5-year Expected Annual Returns: 16.9%
Brown & Brown Inc. is a leading insurance brokerage firm that provides risk management solutions to both individuals and businesses, with a focus on property & casualty insurance. Brown & Brown has a notably high level of insider ownership.
Brown & Brown posted third quarter earnings on October 27th, 2025, and results were better than expected. Adjusted earnings-per-share came to $1.05, which was 12 cents ahead of estimates. Revenue soared 35% year-over-year thanks to acquisitions, beating estimates by $70 million at $1.61 billion.
Commissions and fees rose 34% year-over-year, while organic revenue (which excludes acquisitions) rose 3.5%. Income before taxes was $311 million, which was off 2% year-over-year, with margin declining from 26.7% of revenue to 19.4%.
For the nine months, revenue was up 19% year-over-year to $4.3 billion, with commissions and fees up 18%. Organic revenue growth was 4.6%. Income before taxes was $1 billion, up 2%, on margin that fell from 28.4% to 24.4% of revenue. EBITDAC was $1.6 billion on EBITDAC margin that rose from 35.9% to 37.1% of revenue.
We have slightly boosted our estimate of earnings-per-share for this year to $4.20. The company also boosted its dividend for the 32nd consecutive year, raising it by 10% to a new payout of 66 cents per share annually.
Click here to download our most recent Sure Analysis report on BRO (preview of page 1 of 3 shown below):
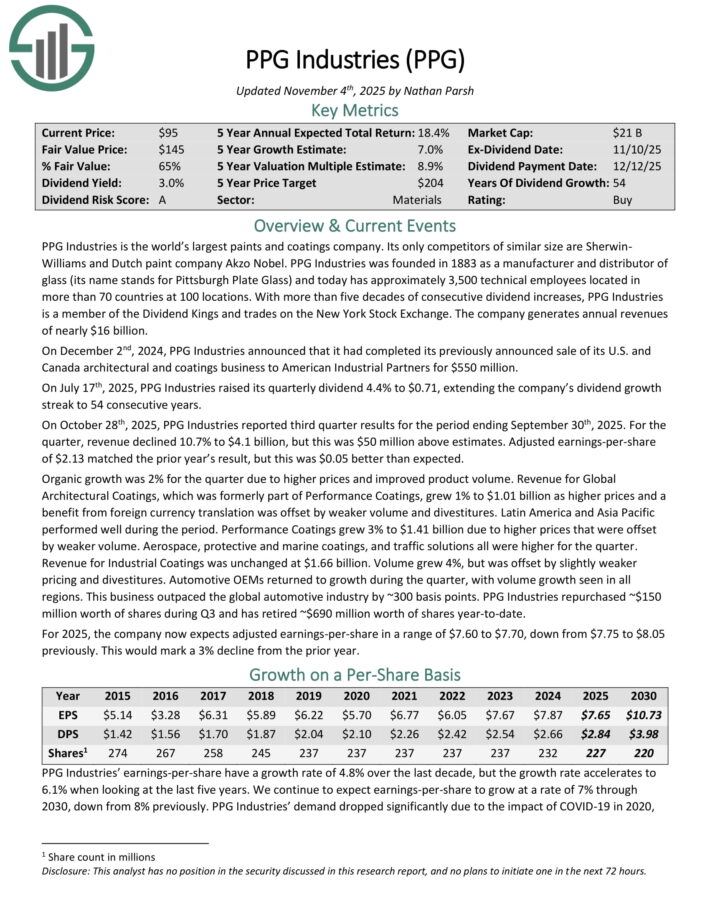
Dividend Aristocrat #4: PPG Industries (PPG)
5-year Expected Annual Returns: 17.1%
PPG Industries is the world’s largest paints and coatings company. Its only competitors of similar size are Sherwin-Williams and Dutch paint company Akzo Nobel.
PPG Industries was founded in 1883 as a manufacturer and distributor of glass (its name stands for Pittsburgh Plate Glass) and today has approximately 3,500 technical employees located in more than 70 countries at 100 locations.
On July 17th, 2025, PPG Industries raised its quarterly dividend 4.4% to $0.71, extending the company’s dividend growth streak to 54 consecutive years.
On October 28th, 2025, PPG Industries reported third quarter results for the period ending September 30th, 2025. For the quarter, revenue declined 10.7% to $4.1 billion, but this was $50 million above estimates. Adjusted earnings-per-share of $2.13 matched the prior year’s result, but this was $0.05 better than expected.
Organic growth was 2% for the quarter due to higher prices and improved product volume. Revenue for Global Architectural Coatings, which was formerly part of Performance Coatings, grew 1% to $1.01 billion as higher prices and a benefit from foreign currency translation was offset by weaker volume and divestitures.
Latin America and Asia Pacific performed well during the period. Performance Coatings grew 3% to $1.41 billion due to higher prices that were offset by weaker volume. Aerospace, protective and marine coatings, and traffic solutions all were higher for the quarter.
Revenue for Industrial Coatings was unchanged at $1.66 billion. Volume grew 4%, but was offset by slightly weaker pricing and divestitures. Automotive OEMs returned to growth during the quarter, with volume growth seen in all regions. This business outpaced the global automotive industry by ~300 basis points.
PPG Industries repurchased ~$150 million worth of shares during Q3 and has retired ~$690 million worth of shares year-to-date.
For 2025, the company now expects adjusted earnings-per-share in a range of $7.60 to $7.70.
Click here to download our most recent Sure Analysis report on PPG (preview of page 1 of 3 shown below):
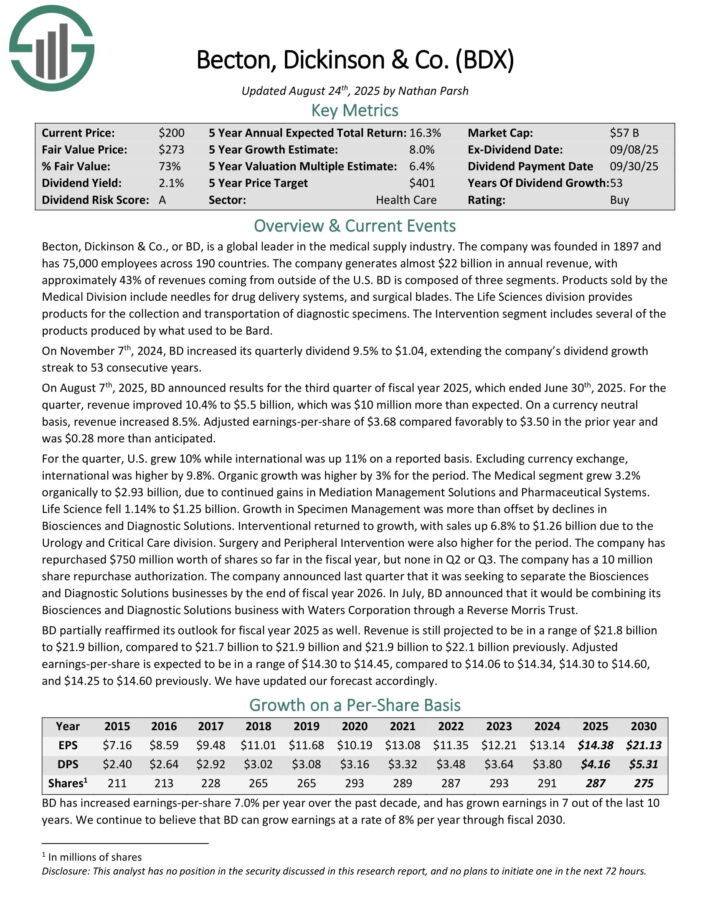
Dividend Aristocrat #3: Becton Dickinson & Co. (BDX)
5-year Expected Annual Returns: 17.4%
Becton, Dickinson & Co. is a global leader in the medical supply industry. The company was founded in 1897 and has 75,000 employees across 190 countries.
The company generates about $20 billion in annual revenue, with approximately 43% of revenues coming from outside of the U.S.
Becton, Dickinson & Co., or BD, is a global leader in the medical supply industry. The company generates almost $22 billion in annual revenue, with approximately 43% of revenues coming from outside of the U.S.
BD is composed of three segments. Products sold by the Medical Division include needles for drug delivery systems, and surgical blades. The Life Sciences division provides products for the collection and transportation of diagnostic specimens. The Intervention segment includes several of the products produced by what used to be Bard.
On August 7th, 2025, BD announced results for the third quarter of fiscal year 2025, which ended June 30th, 2025. For the quarter, revenue improved 10.4% to $5.5 billion, which was $10 million more than expected.
On a currency neutral basis, revenue increased 8.5%. Adjusted earnings-per-share of $3.68 compared favorably to $3.50 in the prior year and was $0.28 more than anticipated.
For the quarter, U.S. grew 10% while international was up 11% on a reported basis. Excluding currency exchange, international was higher by 9.8%. Organic growth was higher by 3% for the period.
The Medical segment grew 3.2% organically to $2.93 billion, due to continued gains in Mediation Management Solutions and Pharmaceutical Systems.
Life Science fell 1.14% to $1.25 billion. Growth in Specimen Management was more than offset by declines in Biosciences and Diagnostic Solutions. Interventional returned to growth, with sales up 6.8% to $1.26 billion due to the Urology and Critical Care division. Surgery and Peripheral Intervention were also higher for the period.
BD partially reaffirmed its outlook for fiscal year 2025 as well. Revenue is still projected to be in a range of $21.8 billion to $21.9 billion, compared to $21.7 billion to $21.9 billion and $21.9 billion to $22.1 billion previously. Adjusted earnings-per-share is expected to be in a range of $14.30 to $14.45.
Click here to download our most recent Sure Analysis report on BDX (preview of page 1 of 3 shown below):
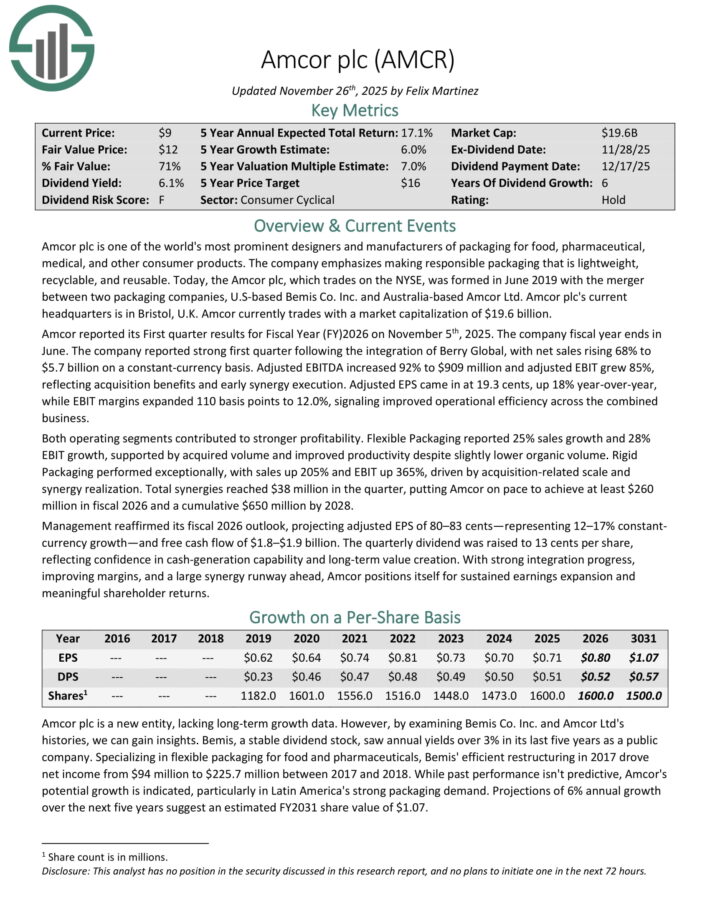
Dividend Aristocrat #2: Amcor plc (AMCR)
5-year Expected Annual Returns: 17.5%
Amcor plc is one of the world’s most prominent designers and manufacturers of packaging for food, pharmaceutical, medical, and other consumer products.
The company emphasizes making responsible packaging that is lightweight, recyclable, and reusable.
Amcor reported its First quarter results for Fiscal Year (FY) 2026 on November 5th, 2025. The company fiscal year ends in June.
The company reported strong first quarter following the integration of Berry Global, with net sales rising 68% to $5.7 billion on a constant-currency basis.
Adjusted EBITDA increased 92% to $909 million and adjusted EBIT grew 85%, reflecting acquisition benefits and early synergy execution.
Adjusted EPS came in at 19.3 cents, up 18% year-over-year, while EBIT margins expanded 110 basis points to 12.0%, signaling improved operational efficiency across the combined business.
Both operating segments contributed to stronger profitability. Flexible Packaging reported 25% sales growth and 28% EBIT growth, supported by acquired volume and improved productivity despite slightly lower organic volume.
Rigid Packaging performed exceptionally, with sales up 205% and EBIT up 365%, driven by acquisition-related scale and synergy realization.
Click here to download our most recent Sure Analysis report on AMCR (preview of page 1 of 3 shown below):
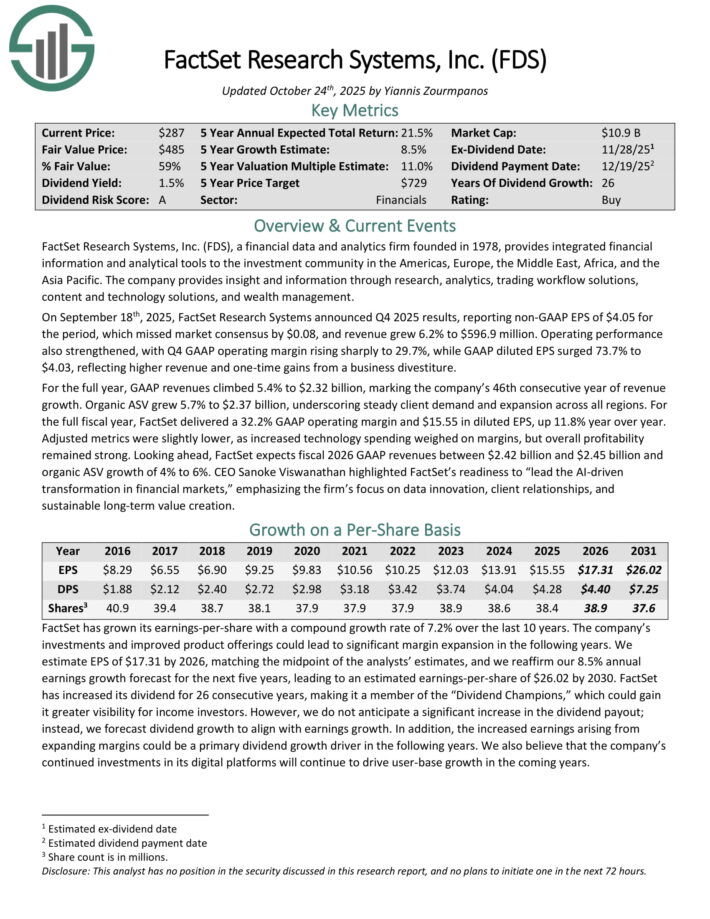
Dividend Aristocrat #1: Factset Research Systems (FDS)
5-year Expected Annual Returns: 22.2%
FactSet Research Systems, a financial data and analytics firm founded in 1978, provides integrated financial information and analytical tools to the investment community in the Americas, Europe, the Middle East, Africa, and Asia-Pacific.
The company provides insight and information through research, analytics, trading workflow solutions, content and technology solutions, and wealth management.
On September 18th, 2025, FactSet Research Systems announced Q4 2025 results, reporting non-GAAP EPS of $4.05 for the period, which missed market consensus by $0.08, and revenue grew 6.2% to $596.9 million. Operating performance also strengthened, with Q4 GAAP operating margin rising sharply to 29.7%.
GAAP diluted EPS surged 73.7% to $4.03, reflecting higher revenue and one-time gains from a business divestiture. For the full year, GAAP revenues climbed 5.4% to $2.32 billion, marking the company’s 46th consecutive year of revenue growth.
Organic ASV grew 5.7% to $2.37 billion, underscoring steady client demand and expansion across all regions. For the full fiscal year, FactSet delivered a 32.2% GAAP operating margin and $15.55 in diluted EPS, up 11.8% year over year.
Adjusted metrics were slightly lower, as increased technology spending weighed on margins, but overall profitability remained strong. Looking ahead, FactSet expects fiscal 2026 GAAP revenues between $2.42 billion and $2.45 billion and organic ASV growth of 4% to 6%.
Click here to download our most recent Sure Analysis report on FDS (preview of page 1 of 3 shown below):
The Dividend Aristocrats In Focus Analysis Series
You can see analysis on every single Dividend Aristocrat below. Each is sorted by GICS sectors and listed in alphabetical order by name. The newest Sure Analysis Research Database report for each security is included as well.
Consumer Staples
Industrials
Health Care
Consumer Discretionary
Financials
Materials
Energy
Information Technology
Real Estate
Utilities
Historical Dividend Aristocrats List(1989 – 2025)
The image below shows the history of the Dividend Aristocrats Index from 1989 through 2025:
Note: CL, GPC, and NUE were all removed and re-added to the Dividend Aristocrats Index through the historical period analyzed above. We are unsure as to why. Companies created via a spin-off (like AbbVie) can be Dividend Aristocrats with less than 25 years of rising dividends if the parent company was a Dividend Aristocrat.
Disclaimer: Sure Dividend is not affiliated with S&P Global in any way. S&P Global owns and maintains The Dividend Aristocrats Index. The information in this article and downloadable spreadsheet and image below is based on Sure Dividend’s own review, summary, and analysis of the S&P 500 Dividend Aristocrats ETF (NOBL) and other sources, and is meant to help individual investors better understand this ETF and the index upon which it is based. None of the information in this article or spreadsheet is official data from S&P Global. Consult S&P Global for official information.

This information was compiled from the following sources:
Frequently Asked Questions
This section will address some of most common questions investors have regarding the Dividend Aristocrats.
1. What is the highest-paying Dividend Aristocrat?
Answer: Amcor currently yields 6.2%.
2. What is the difference between the Dividend Aristocrats and the Dividend Kings?
Answer: The Dividend Aristocrats must be constituents of the S&P 500 Index, have raised their dividends for at least 25 consecutive years, and satisfy a number of liquidity requirements.
The Dividend Kings only need to have raised their dividends for at least 50 consecutive years.
3. Is there an ETF that tracks the Dividend Aristocrats?
Answer: Yes, the Dividend Aristocrats ETF (NOBL) is an exchange-traded fund that specifically holds the Dividend Aristocrats.
4. What is the difference between the Dividend Aristocrats and the Dividend Champions?
Answer: The Dividend Aristocrats and Dividend Champions share one requirement, which is that a company must have raised its dividend for at least 25 consecutive years.
But like the Dividend Kings, the Dividend Champions do not need to be in the S&P 500 Index, nor satisfy the various liquidity requirements.
5. Which Dividend Aristocrat has the longest active streak of annual dividend increases?
Currently, there are 3 Dividend Aristocrats tied at 69 years: Procter & Gamble, Genuine Parts, and Dover Corporation.
6. What is the average dividend yield of the Dividend Aristocrats?
Right now, the average dividend yield of the Dividend Aristocrats is 2.1%.
7. Are the Dividend Aristocrats safe investments?
While there are never any guarantees when it comes to the stock market, we believe the Dividend Aristocrats are among the safest dividend stocks when it comes to the sustainability of their dividend payouts.
The Dividend Aristocrats have durable competitive advantages that allow them to raise their dividends each year, even during a recession.
Other Dividend Lists & Final Thoughts
The Dividend Aristocrats list is not the only way to quickly screen for stocks that regularly pay rising dividends.
The Dividend Kings List is even more exclusive than the Dividend Aristocrats. It is comprised of 56 stocks with 50+ years of consecutive dividend increases.
The Blue Chip Stocks List: stocks that qualify as Dividend Achievers, Dividend Aristocrats, and/or Dividend Kings
The High Dividend Stocks List: stocks that appeal to investors interested in the highest yields of 5% or more.
The Monthly Dividend Stocks List: stocks that pay dividends every month, for 12 dividend payments per year.
There is nothing magical about the Dividend Aristocrats. They are ‘just’ a collection of high-quality shareholder friendly stocks that have strong competitive advantages.
Purchasing these types of stocks at fair or better prices and holding for the long-run will likely result in favorable long-term performance.
Thanks for reading this article. Please send any feedback, corrections, or questions to [email protected].


")


")


