
Updated on February 2nd, 2023 by Bob CiuraSpreadsheet data updated daily
Monthly dividend stocks are securities that pay a dividend every month instead of quarterly or annually. More frequent dividend payments mean a smoother income stream for investors.
This article includes:
A free spreadsheet on all 50 monthly dividend stocks
Links to detailed stand-alone analysis on all 50 monthly dividend stocks
Several other resources to help you invest in monthly dividend securities for steady income
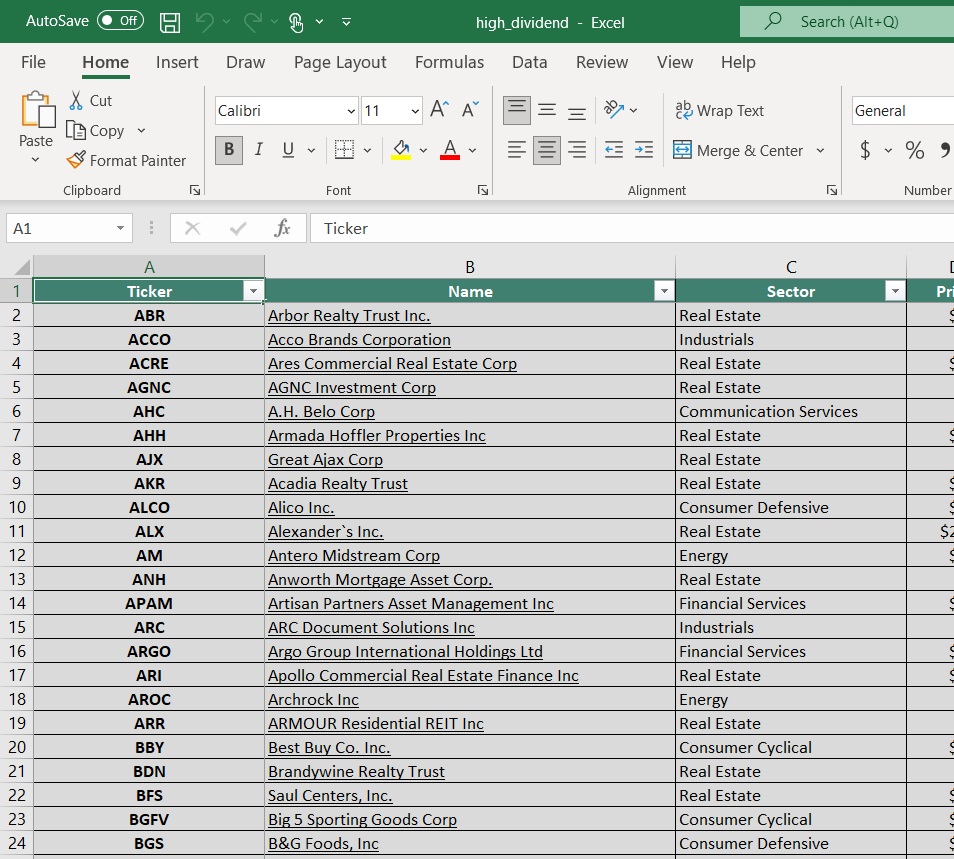
You can download our full Excel spreadsheet of all monthly dividend stocks (along with metrics that matter like dividend yield and payout ratio) by clicking on the link below:
The downloadable Monthly Dividend Stocks Spreadsheet above contains the following for each stock that pays monthly dividends:
Dividend yield
Name and ticker
Market cap
Payout ratio
Beta
Note: We strive to maintain an accurate list of all monthly dividend payers. There’s no universal source we are aware of for monthly dividend stocks; we curate this list manually. If you know of any stocks that pay monthly dividends that are not on our list, please email [email protected].
This article also includes our top 5 ranked monthly dividend stocks today, according to expected five-year annual returns.
We have excluded oil and gas royalty trusts due to their high risks. These high risks make them less attractive for income investors, in our view.
Table of Contents
Having the list of monthly dividend stocks along with metrics that matter is a great way to begin creating a monthly passive income stream.
High-yielding monthly dividend payers have a unique mix of characteristics that make them especially suitable for investors seeking current income.
Keep reading this article to learn more about investing in monthly dividend stocks.
How to Use the Monthly Dividend Stocks Sheet to Find Dividend Investment Ideas
For investors that use their dividend stock portfolios to generate passive monthly income, one of the main concerns is the sustainability of the company’s dividend.
A dividend cut indicates one of two things:
The business isn’t performing well enough to sustain a dividend
Management is no longer interested in rewarding shareholders with dividends
Either of these should be considered an automatic sign to sell a dividend stock.
Of the two reasons listed above, #1 is more likely to happen. Thus, it is very important to continually monitor the financial feasibility of a company’s dividend.
This is best evaluated by using the payout ratio. The payout ratio is a mathematical expression that shows what percentage of a company’s earnings is distributed to shareholders as dividend payments. A very high payout ratio could indicate that a company’s dividend is in danger of being reduced or eliminated completely.
For readers unfamiliar with Microsoft Excel, this section will show you how to list the stocks in the spreadsheet in order of decreasing payout ratio.
Step 1: Download the monthly dividend stocks excel sheet at the link above.
Step 2: Highlight columns A through H, and go to “Data”, then “Filter”.
Step 3: Click on the ‘filter’ icon at the top of the payout ratio column.
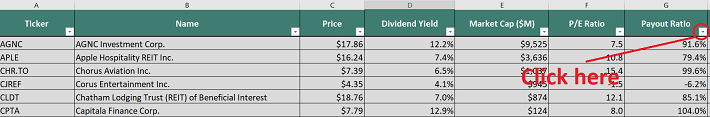
Step 4: Filter the high dividend stocks spreadsheet in descending order by payout ratio. This will list the stocks with lower (safer) payout ratios at the top.
The 5 Best Monthly Dividend Stocks
The following companies represent our top 5 monthly dividend stocks right now. Stocks were selected based on their projected total annual returns over the next five years.
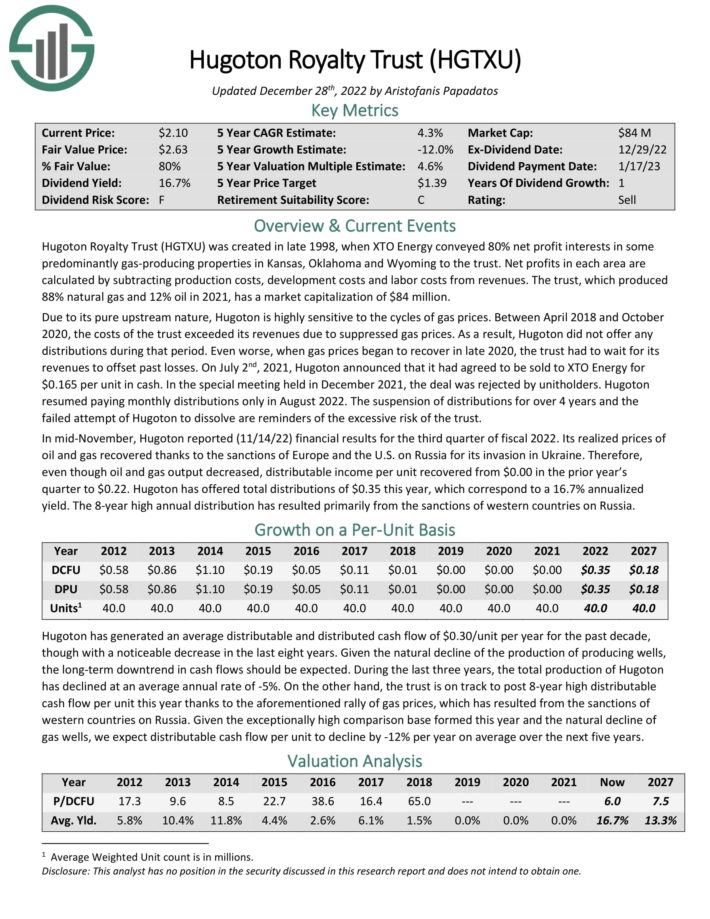
Monthly Dividend Stock #5: Hugoton Royalty Trust (HGTXU)
5-year expected annual returns: 12.6%
Hugoton Royalty Trust was created in late 1998, when XTO Energy conveyed 80% net profit interests in some predominantly gas-producing properties in Kansas, Oklahoma and Wyoming to the trust. Net profits in each area are calculated by subtracting production costs, development costs and labor costs from revenues. The trust, which produced 88% natural gas and 12% oil in 2021, has a market capitalization of $84 million.
Due to its pure upstream nature, Hugoton is highly sensitive to the cycles of gas prices. Between April 2018 and October 2020, the costs of the trust exceeded its revenues due to suppressed gas prices. As a result, Hugoton did not offer any distributions during that period. Even worse, when gas prices began to recover in late 2020, the trust had to wait for its revenues to offset past losses. Hugoton resumed paying monthly distributions only in August 2022.
In mid-November, Hugoton reported (11/14/22) financial results for the third quarter of fiscal 2022. Its realized prices of oil and gas recovered thanks to the sanctions of Europe and the U.S. on Russia for its invasion in Ukraine. Therefore, even though oil and gas output decreased, distributable income per unit recovered from $0.00 in the prior year’s quarter to $0.22.
Click here to download our most recent Sure Analysis report on HGTXU (preview of page 1 of 3 shown below):
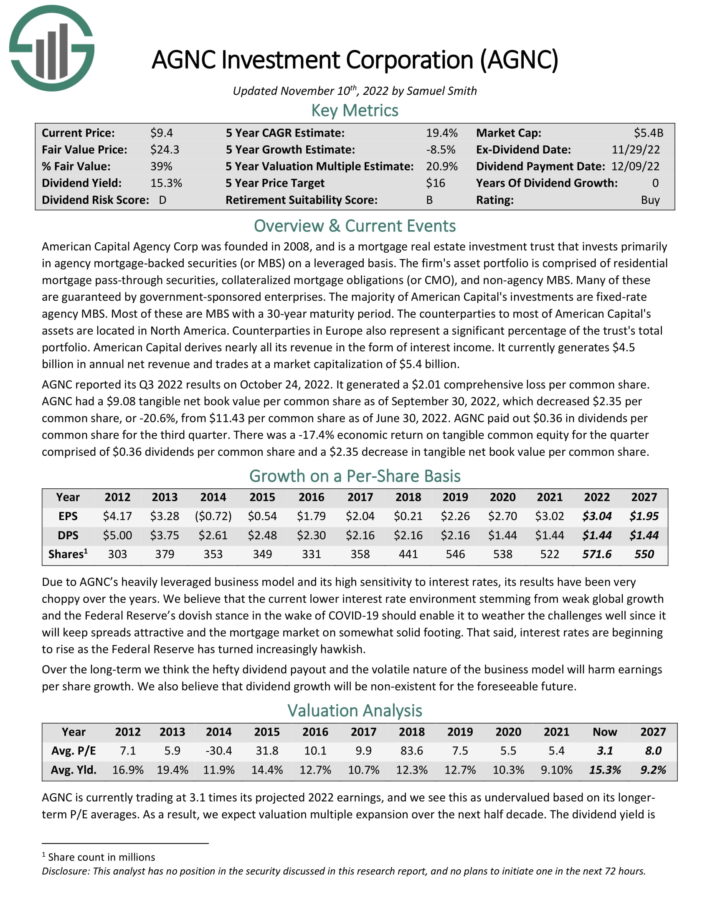
Monthly Dividend Stock #4: AGNC Investment Corporation (AGNC)
5-year expected annual returns: 13.8%
American Capital Agency Corp was founded in 2008, and is a mortgage real estate investment trust that invests primarily in agency mortgage-backed securities (or MBS) on a leveraged basis.
The firm’s asset portfolio is comprised of residential mortgage pass-through securities, collateralized mortgage obligations (or CMO), and non-agency MBS. Many of these are guaranteed by government sponsored enterprises.
The majority of American Capital’s investments are fixed rate agency MBS. Most of these are MBS with a 30-year maturity period. AGNC derives nearly all its revenue in the form of interest income. It currently generates $1.2 billion in annual net revenue.
AGNC reported its Q3 2022 results on October 24, 2022. It generated a $2.01 comprehensive loss per common share. AGNC had a $9.08 tangible net book value per common share as of September 30, 2022, which decreased $2.35 per common share, or -20.6%, from $11.43 per common share as of June 30, 2022.
AGNC paid out $0.36 in dividends per common share for the third quarter. There was a -17.4% economic return on tangible common equity for the quarter comprised of $0.36 dividends per common share and a $2.35 decrease in tangible net book value per common share.
We expect 13.8% annual returns for AGNC, made up of the 12.0% dividend yield, negative EPS growth of -0.9%, and a small boost from a rising P/FFO multiple.
Click here to download our most recent Sure Analysis report on AGNC (preview of page 1 of 3 shown below):
Monthly Dividend Stock #3: Broadmark Realty Capital (BRMK)
5-year expected annual returns: 15.4%
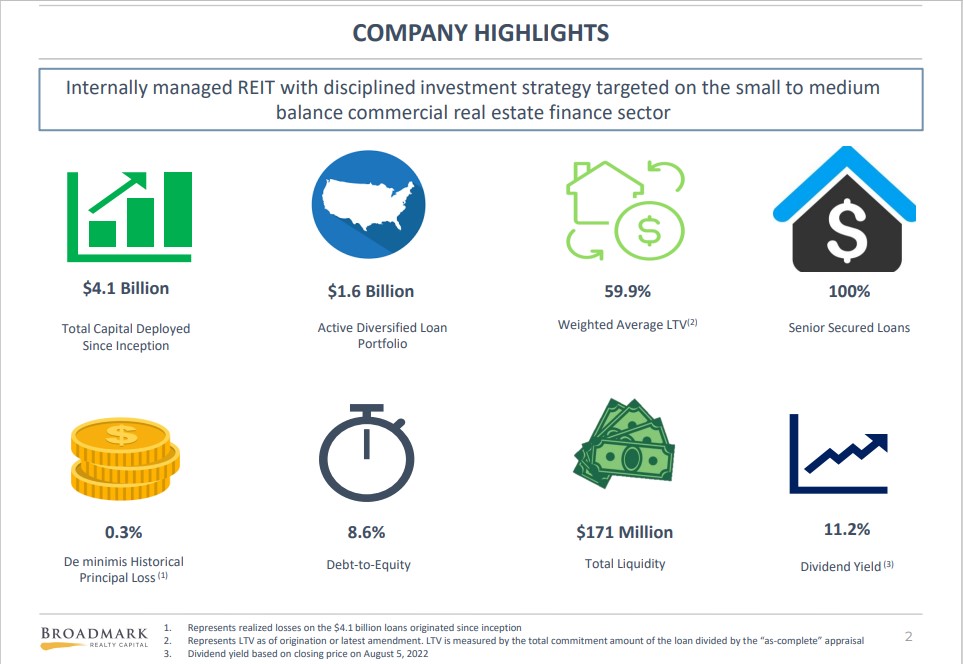
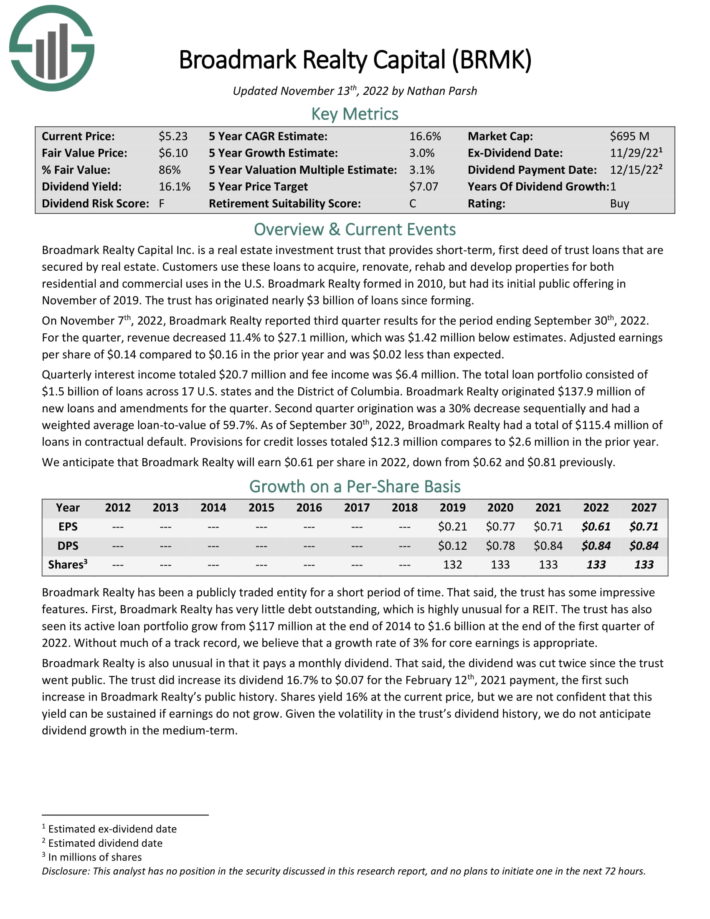
Broadmark Realty Capital Inc. is a real estate investment trust that provides short-term, first deed of trust loans that are secured by real estate. Customers use these loans to acquire, renovate, rehab and develop properties for both residential and commercial uses in the U.S. Broadmark Realty formed in 2010, but had its initial public offering in November 2019.
Source: Investor Presentation
On November 7th, 2022, Broadmark Realty reported third quarter results for the period ending September 30th, 2022. For the quarter, revenue decreased 11.4% to $27.1 million, which was $1.42 million below estimates. Adjusted earnings per share of $0.14 compared to $0.16 in the prior year and was $0.02 less than expected.
Quarterly interest income totaled $20.7 million and fee income was $6.4 million. The total loan portfolio consisted of $1.5 billion of loans across 17 U.S. states and the District of Columbia. Broadmark Realty originated $137.9 million of new loans and amendments for the quarter. Second quarter origination was a 30% decrease sequentially and had a weighted average loan-to-value of 59.7%.
As of September 30th, 2022, Broadmark Realty had a total of $115.4 million of loans in contractual default. Provisions for credit losses totaled $12.3 million compares to $2.6 million in the prior year.
Click here to download our most recent Sure Analysis report on BRMK (preview of page 1 of 3 shown below):
Monthly Dividend Stock #2: SL Green Realty (SLG)
5-year expected annual returns: 15.8%
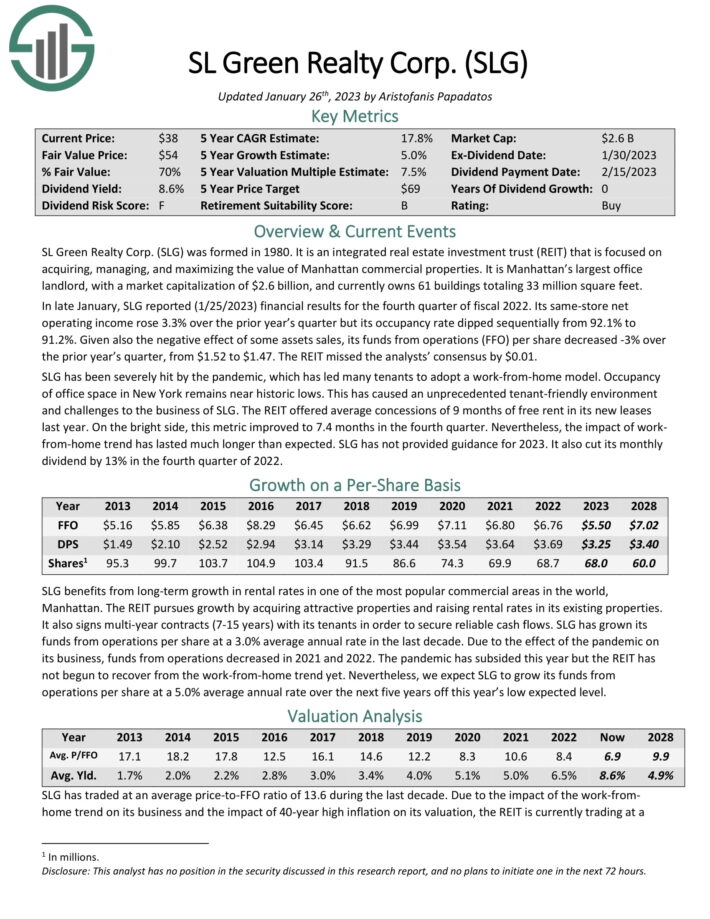
SL Green Realty Corp was formed in 1980. It is an integrated real estate investment trust (REIT) that is focused on acquiring, managing, and maximizing the value of Manhattan commercial properties.
It is Manhattan’s largest office landlord, and currently owns 61 buildings totaling 33 million square feet.

Source: Investor Presentation
In late January, SLG reported (1/25/2023) financial results for the fourth quarter of fiscal 2022. Its same-store net operating income rose 3.3% over the prior year’s quarter but its occupancy rate dipped sequentially from 92.1% to 91.2%.
Given also the negative effect of some assets sales, its funds from operations (FFO) per share decreased -3% over the prior year’s quarter, from $1.52 to $1.47. The REIT missed the analysts’ consensus by $0.01.
Click here to download our most recent Sure Analysis report on SLG (preview of page 1 of 3 shown below):
Monthly Dividend Stock #1: ARMOUR Residential REIT (ARR)
5-year expected annual returns: 17.5%
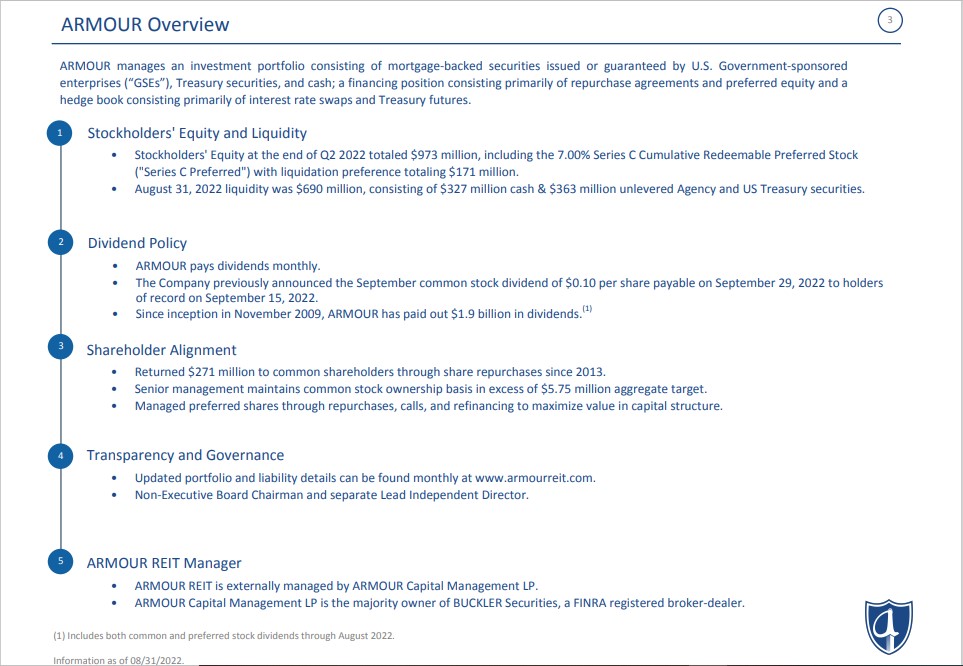
ARMOUR is a mortgage REIT that invests primarily in residential mortgage–backed securities that are guaranteed or issued by a United States government entity including Fannie Mae, Freddie Mac and Ginnie Mae.
Source: Investor Presentation
ARMOUR reported Q3 results on October 26th, 2022. It generated a comprehensive loss of $(155.7) million or $(1.26) per common share. Distributable Earnings were $38.8 million, representing $0.32 per common share. The REIT paid common stock dividends of $0.10 per share per month during the quarter and raised $167.2 million of capital by issuing 22,733,043 shares of common stock at $7.36 net proceeds per share, after fees and expenses.
Management has also repurchased 780,000 shares of common stock at an average cost of $4.96 per share. Net interest income was $25.1 million, while the net interest margin of 2.21% was down one basis point from the prior quarter.
Book value per common share was $5.83, while total liquidity was $469.3 million. The debt-to-equity ratio was 8.7 to 1, while leverage, net of TBA Security short positions, was 7.8 to 1. Implied leverage, adjusted for forward settling sales and unsettled purchases, was 7.3 to 1. Interest Rate swap contracts totaled $6.5 billion of notional amount, representing 90% of the total repurchase agreement and TBA Securities liabilities.
Click here to download our most recent Sure Analysis report on ARMOUR Residential REIT (ARR) (preview of page 1 of 3 shown below):

Detailed Analysis On All of The Monthly Dividend Stocks
You can see detailed analysis on monthly dividend securities we cover by clicking the links below. We’ve included our most recent Sure Analysis Research Database report update in brackets as well, where applicable.
Agree Realty (ADC) | [See Newest Sure Analysis Report]
AGNC Investment (AGNC) | [See Newest Sure Analysis Report]
Apple Hospitality REIT, Inc. (APLE) | See Newest Sure Analysis Report
ARMOUR Residential REIT (ARR) | [See Newest Sure Analysis Report]
Banco Bradesco S.A. (BBD) | [See Newest Sure Analysis Report]
Broadmark Realty Capital (BRMK) | [See Newest Sure Analysis Report]
Chatham Lodging (CLDT)* | [See Newest Sure Analysis Report]
Choice Properties REIT (PPRQF) | [See Newest Sure Analysis Report]
Cross Timbers Royalty Trust (CRT) | [See Newest Sure Analysis Report]
Dream Industrial REIT (DREUF) | [See Newest Sure Analysis Report]
Dream Office REIT (DRETF) | [See Newest Sure Analysis Report]
Dynex Capital (DX) | [See Newest Sure Analysis Report]
Ellington Residential Mortgage REIT (EARN) | [See Newest Sure Analysis Report]
Ellington Financial (EFC) | [See Newest Sure Analysis Report]
EPR Properties (EPR) | [See Newest Sure Analysis Report]
Exchange Income Corporation (EIFZF) | [See Newest Sure Analysis Report]
Fortitude Gold (FTCO) | [See Newest Sure Analysis Report]
Generation Income Properties (GIPR) | [See Newest Sure Analysis Report]
Gladstone Capital Corporation (GLAD) | [See Newest Sure Analysis Report]
Gladstone Commercial Corporation (GOOD) | [See Newest Sure Analysis Report]
Gladstone Investment Corporation (GAIN) | [See Newest Sure Analysis Report]
Gladstone Land Corporation (LAND) | [See Newest Sure Analysis Report]
Global Water Resources (GWRS) | [See Newest Sure Analysis Report]
Granite Real Estate Investment Trust (GRP.U)** | [Historical Reports]
Horizon Technology Finance (HRZN) | [See Newest Sure Analysis Report]
Hugoton Royalty Trust (HGTXU) | [See Newest Sure Analysis Report]
Itaú Unibanco (ITUB) | [See Newest Sure Analysis Report]
LTC Properties (LTC) | [See Newest Sure Analysis Report]
Main Street Capital (MAIN) | [See Newest Sure Analysis Report]
Orchid Island Capital (ORC) | [See Newest Sure Analysis Report]
Oxford Square Capital (OXSQ) | [See Newest Sure Analysis Report]
Pembina Pipeline (PBA) | [See Newest Sure Analysis Report]
Permian Basin Royalty Trust (PBT) | [See Newest Sure Analysis Report]
Phillips Edison & Company (PECO) | [See Newest Sure Analysis Report]
Pennant Park Floating Rate (PFLT) | [See Newest Sure Analysis Report]
PermRock Royalty Trust (PRT) | [See Newest Sure Analysis Report]
Prospect Capital Corporation (PSEC) | [See Newest Sure Analysis Report]
Permianville Royalty Trust (PVL)
Realty Income (O) | [See Newest Sure Analysis Report]
Sabine Royalty Trust (SBR) | [See Newest Sure Analysis Report]
Stellus Capital Investment Corp. (SCM) | [See Newest Sure Analysis Report]
San Juan Basin Royalty Trust (SJT)
Shaw Communications (SJR) | [See Newest Sure Analysis Report]
SL Green Realty Corp. (SLG) | [See Newest Sure Analysis Report]
SLR Investment Corp. (SLRC) | [See Newest Sure Analysis Report]
Stag Industrial (STAG) | [See Newest Sure Analysis Report]
Superior Plus (SUUIF) | [See Newest Sure Analysis Report]
TransAlta Renewables (TRSWF) | [See Newest Sure Analysis Report]
U.S. Global Investors (GROW) | [See Newest Sure Analysis Report]
Whitestone REIT (WSR) | [See Newest Sure Analysis Report]
Note 1: The asterisk (*) denotes a stock that has suspended its dividend. As a result, we have not included the stock in our annual Monthly Dividend Stock In Focus Series. We will resume coverage when and if the company in question resumes paying dividends.
Note 2: The double asterisk (**) denotes a security that is not included by our data provider and is therefore excluded from our Sure Analysis research database despite being a monthly paying dividend stock.
As we do not have coverage of every monthly dividend stock, they are not all included in the list above. Note that most of these businesses are either small or mid-cap companies.
You will not see any S&P 500 stocks in this list – it is predominantly populated by members of the Russell 2000 Index or various international stock market indices.
Based on the list above, the bulk of monthly dividend paying securities are REITs and BDCs.
Performance Through January 2023
In January 2023, a basket of the 50 monthly dividend stocks above (excluding SJT) generated total returns of 7.2%. For comparison, the Russell 2000 ETF (IWM) generated total returns of -6.5% for the month.
Notes: Data for performance is from Ycharts. Canadian company performance may be in the company’s home currency. Year-to-date performance does have survivorship bias as some securities have been excluded as they eliminated their dividends. Global Net Lease (GNL) was also eliminated as it changed its dividend to quarterly payments.
Monthly dividend stocks out-performed in January. We will update our performance section monthly to track future monthly dividend stock returns.
In January 2023, the 3 best-performing monthly dividend stocks (including dividends) were:
Broadmark Realty (BRMK), up 24.0%
SL Green Realty (SLG), up 22.9%
Dream Industrial Real Estate Investment Trust (DREUF), up 19.8%
The 3 worst-performing monthly dividend stocks (including dividends) in January were:
Vermilion Energy (VET), down 13.3%
Permianville Royalty Trust (PVL), down 8.2%
Gladstone Commercial (GOOD), down 7.6%
Why Monthly Dividends Matter
Monthly dividend payments are beneficial for one group of investors in particular – retirees who rely on dividend stocks for income.
With that said, monthly dividend stocks are better under all circumstances (everything else being equal), because they allow for returns to be compounded on a more frequent basis. More frequent compounding results in better total returns, particularly over long periods of time.
Consider the following performance comparison:
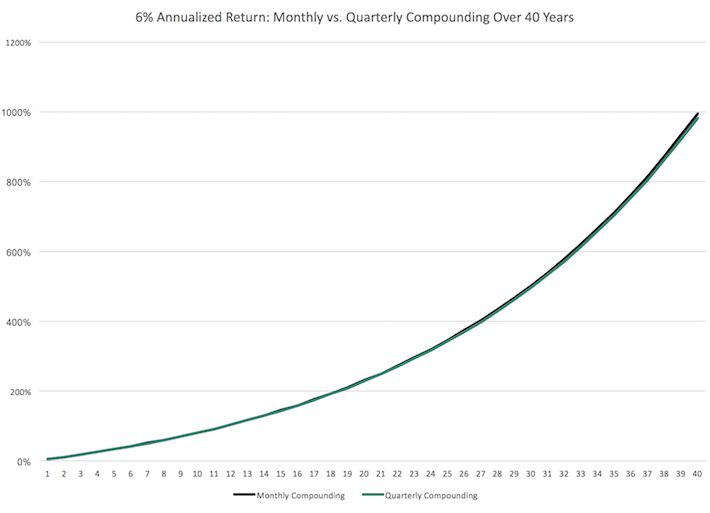
Over the long run, monthly compounding generates slightly higher returns over quarterly compounding. Every little bit helps.
With that said, it might not be practical to manually re-invest dividend payments on a monthly basis. It is more feasible to combine monthly dividend stocks with a dividend reinvestment plan to dollar cost average into your favorite dividend stocks.
The last benefit of monthly dividend stocks is that they allow investors to have – on average – more cash on hand to make opportunistic purchases. A monthly dividend payment is more likely to put cash in your account when you need it versus a quarterly dividend.
Case-in-point: Investors who bought a broad basket of stocks at the bottom of the 2008-2009 financial crisis are likely sitting on triple-digit total returns from those purchases today.
The Dangers of Investing In Monthly Dividend Stocks
Monthly dividend stocks have characteristics that make them appealing to do-it-yourself investors looking for a steady stream of income. Typically, these are retirees and people planning for retirement.
Investors should note many monthly dividend stocks are highly speculative. On average, monthly dividend stocks tend to have elevated payout ratios. An elevated payout ratio means there’s less margin for error to continue paying the dividend if business results suffer a temporary (or permanent) decline.
As a result, we have real concerns that many monthly dividend payers will not be able to continue paying rising dividends in the event of a recession.
Additionally, a high payout ratio means that a company is retaining little money to invest for future growth. This can lead management teams to aggressively leverage their balance sheet, fueling growth with debt. High debt and a high payout ratio is perhaps the most dangerous combination around for a potential future dividend reduction.
With that said, there are a handful of high-quality monthly dividend payers around. Chief among them is Realty Income (O). Realty Income has paid increasing dividends (on an annual basis) every year since 1994.
The Realty Income example shows that there are high-quality monthly dividend payers around, but they are the exception rather than the norm. We suggest investors do ample due diligence before buying into any monthly dividend payer.
Final Thoughts
Financial freedom is achieved when your passive investment income exceeds your expenses. But the sequence and timing of your passive income investment payments can matter.
Monthly payments make matching portfolio income with expenses easier. Most personal expenses recur monthly whereas most dividend stocks pay quarterly. Investing in monthly dividend stocks matches the frequency of portfolio income payments with the normal frequency of personal expenses.
Additionally, many monthly dividend payers offer investors high yields. The combination of a monthly dividend payment and a high yield should be especially appealing to income investors.
But not all monthly dividend payers offer the safety that income investors need. A monthly dividend is better than a quarterly dividend, but not if that monthly dividend is reduced soon after you invest. The high payout ratios and shorter histories of most monthly dividend securities mean they tend to have elevated risk levels.
Because of this, we advise investors to look for high-quality monthly dividend payers with reasonable payout ratios, trading at fair or better prices.

If you are interested in finding more high-quality dividend growth stocks suitable for long-term investment, the following Sure Dividend databases will be useful:
Thanks for reading this article. Please send any feedback, corrections, or questions to [email protected].


