
 Fool’s Gold, April 1")
Gold has a way of confusing people in the moment. When tensions rise or headlines turn dramatic, the expectation is that gold should respond immediately.
Sometimes it does. Often it doesn’t.
A more useful way to look at it is in terms of sequence rather than reaction. In prior periods, the move in gold tended to follow changes in other parts of the system — bond yields, currency markets and credit conditions.
Once those began to shift, gold usually reflected the adjustment with a lag.
That pattern is clear in three earlier periods: the 1930s, the 1970s and the 2000s. Looking at those episodes side by side offers a useful reference point for thinking about the current energy shock caused by the Iran conflict.
🏛️ Three Earlier Cycles
In the 1930s, the initial strain appeared in the banking system. Depositors withdrew funds, banks failed and credit contracted. The response came from policy.
In 1934, the U.S. government revalued gold from $20.67 to $35 per ounce, which effectively reduced the value of the dollar. Gold’s move reflected that change.
In the 1970s, the shift ran through the currency system. In 1971, Richard Nixon ended the dollar’s convertibility into gold.
Oil prices rose sharply later in the decade, inflation followed and interest rates climbed into double digits. Over that period, gold moved from $35 to more than $800 per ounce.
In the 2000s, the pressure came from credit markets. The unwind of the dot-com bubble gave way to a period of expanding leverage in housing and banking.
After 2008, central banks expanded their balance sheets to stabilize the system. Gold rose from roughly $250 in 2000 to around $1,900 by 2011.
Each of these periods began differently, but the structure was similar. Something in the system forced a repricing of money or credit. Policy responded. Capital adjusted.
Gold followed.
The price of Gold since 1913, when the U.S. government began tracking inflation. The chart below shows annual inflation rates from 1913 to 1919. This was a period of high inflation, as prices nearly doubled from 1913 to 1919, with an average inflation rate of 92.86% over those 7 years. (Source: inflationdata.com)
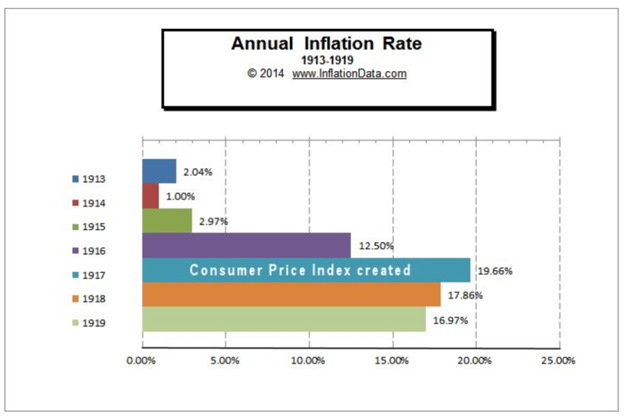
The majority of the inflation occurred between 1916 and 1919. 1913-1915 averaged 2% annual inflation, which is exactly what the modern-day FED considers optimal. But during that period, the gold price was fixed at $20.67 per ounce by law. (Source: inflationdata.com)
📉 Where This Cycle Starts
The current gold market did not begin with a single event. We began recommending gold to readers in 1999 after a substantial 20-year bear market. It began with a set of conditions that had been building over time.
The United States now carries approximately $38 trillion in federal debt. Annual deficits are running near $2 trillion. Long-term obligations tied to Social Security and Medicare add another layer to the picture.
These numbers matter because they require ongoing financing. Treasury securities must be issued continuously, and buyers must be willing to absorb that supply. When supply increases, yields tend to adjust to attract demand. As yields rise, interest costs increase.
So far, that process has remained orderly. But it changes how sensitive the system is to shifts in rates and funding conditions. And events like the current bombing escapade in Iran, temporary as that may be.
🪙 A Gradual Shift in Reserves
Foreign central banks continue to hold large amounts of U.S. assets. That hasn’t changed in a dramatic way.
What has changed is how new reserves are being allocated.
According to IMF data, the dollar’s share of global foreign exchange reserves has declined to 56.8%, the lowest level since the mid-1990s. This decline reflects growth in other assets rather than large-scale selling of dollar holdings.
Gold has been one of the assets receiving those incremental allocations. Central banks and sovereign wealth funds have increased purchases over the past several years, particularly in countries that are less closely aligned with the U.S. financial system.
Regulatory changes have also played a role. Under Basel III rules, implemented in 2023, gold is treated as a Tier 1 asset. That allows banks and central banks to hold it on similar terms to sovereign debt.
Taken together, these developments suggest that gold is being treated more as a reserve asset than it was in the decades immediately following Bretton Woods.
⚙️ The Dollar and Purchasing Power
Another way to view gold is as a measure of purchasing power rather than simply a price.
Over time, the dollar has declined when measured against gold. In the mid-1990s, one dollar purchased more than 120 milligrams of gold. Today, it purchases fewer than 10.
This change reflects a series of decisions made over many years — persistent deficits, growing debt issuance and periodic efforts by central banks to stabilize markets through liquidity programs.
None of these decisions is unusual on its own. Together, they shape how the currency performs over time.
🛢️ Energy as a Near-Term Driver
Disruptions tied to the Strait of Hormuz have affected shipping routes, insurance costs, and delivery times. Oil prices adjusted quickly, and inflation expectations followed.
Historically, energy shocks have often preceded economic slowdowns. Research by economist Tyler Goodspeed, covering several centuries of data, shows that war and energy disruptions frequently coincide with downturns.
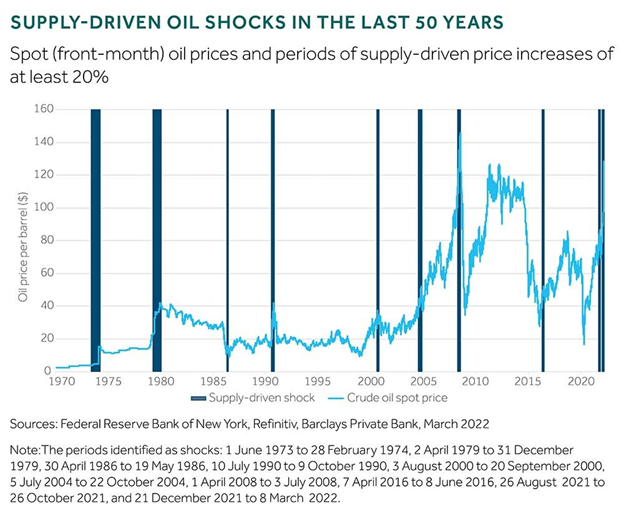
Oil shocks tend to occur as the economy is entering or is about to enter a recession – and are typically accompanied by a selloff in stocks. (Source: Federal Reserve)
The role of policy in those periods is more complicated.
Central banks respond to rising prices, but their tools primarily affect demand rather than supply. Higher interest rates increase borrowing costs across the economy, even when the underlying issue comes from constrained supply.
How that interaction plays out tends to influence the pace of adjustment in both financial markets and the real economy.
🧠 Capital Demand in a New Area
One additional factor in the current cycle is the level of capital required for new infrastructure, particularly in artificial intelligence and energy systems.
Building data centers, expanding power generation and upgrading transmission networks all require significant investment. These projects depend on financing conditions, which are directly influenced by interest rates.
Estimates suggest that hundreds of thousands of additional workers will be needed in energy-related roles over the next decade to support this expansion.
This creates a situation in which higher rates, intended to manage inflation, can also slow investment in areas driving growth.
🎢 Early Signals in Credit Markets
Some of the adjustment is already visible in credit markets.
Credit spreads in certain sectors have widened, reflecting changes in how lenders assess risk. Financial stocks have underperformed the broader market, a pattern that often occurs when funding conditions tighten.
Private credit markets have also shown signs of strain at the margin, as investors reassess liquidity and risk.
These are not unusual developments, but they provide a sense of how capital is beginning to move.
🌍 Putting It Together
The current environment includes several elements that have appeared in earlier gold cycles:
Large and persistent fiscal deficits
A growing stock of sovereign debt
Gradual changes in reserve allocation
Energy-related price pressures
Policy responses that influence credit conditions
At the same time, it includes factors specific to the present, such as the scale of infrastructure investment tied to new technologies. (See Grey Swan Live! below).
It is not necessary to assume a single outcome to observe how these pieces interact. In earlier periods, gold tended to move once adjustments in currency, credit, and reserves were already underway.
Those adjustments are now visible in several parts of the system.
Gold’s role, as has been true for 5,000 years, is simple: it’ll help you build and maintain your wealth through all the short-medium term economic crises, market booms and busts.
Addison Wiggin
Grey Swan Investment Fraternity
P.S. A massive alternative to gold as the monetary unit of choice, in our view, is of course bitcoin, which you may have heard referred to as “digital gold.”
From a portfolio perspective, this is not an “either/or” regarding which assets to choose; it’s “yes/and.” A small allocation will do. And if bitcoin, despite its wild swings, continues to outperform other assets over time, you’ll be glad to have taken a small stake.
In that light, the Dollar 2.0 digital assets like USDC and USDT are early attempts to harness blockchain technology to increase the market share of U.S. dollar and Treasurys.
Tether’s XAUT is a similar effort to tokenize gold. All of these innovations are awaiting passage of the Clarity Act through the U.S. Senate.

In tomorrow’s Grey Swan Live! we’ll be chatting up these digital assets with Ian King. Ian’s got his pulse on the latest technologies and the crypto space, both of which could be surprise winners in the months ahead, especially if we get some, ahem, clarity, from the Clarity Act.


-1024x683.jpg "Florida Roads Become a Battleground for Illegal Immigration")


")


