
Updated on February 9th, 2026 by Bob Ciura
Kevin O’Leary is Chairman of O’Shares Investment Advisors, but you probably know him as “Mr. Wonderful”.
He can be seen on CNBC as well as the television show Shark Tank. Investors who have seen him on TV have likely heard him discuss his investment philosophy.
Mr. Wonderful looks for stocks that exhibit three main characteristics:
First, they must be quality companies with strong financial performance and solid balance sheets.
Second, he believes a portfolio should be diversified across different market sectors.
Third, and perhaps most important, he demands income—he insists the stocks he invests in pay dividends to shareholders.
You can download the complete list of all of O’Shares Investment Advisors stock holdings by clicking the link below:

OUSA owns stocks that display a mix of all three qualities. They are market leaders with strong profits, diversified business models, and they pay dividends to shareholders.
The list of OUSA portfolio holdings is an interesting source of quality dividend growth stocks.
This article analyzes the fund’s largest holdings in detail.
Table of Contents
The top 10 holdings from the O’Shares FTSE U.S. Quality Dividend ETF are listed in order of their weighting in the fund, from lowest to highest.
No. 10: Cisco Systems (CSCO)
Percentage of OUSA Portfolio: 3.1%
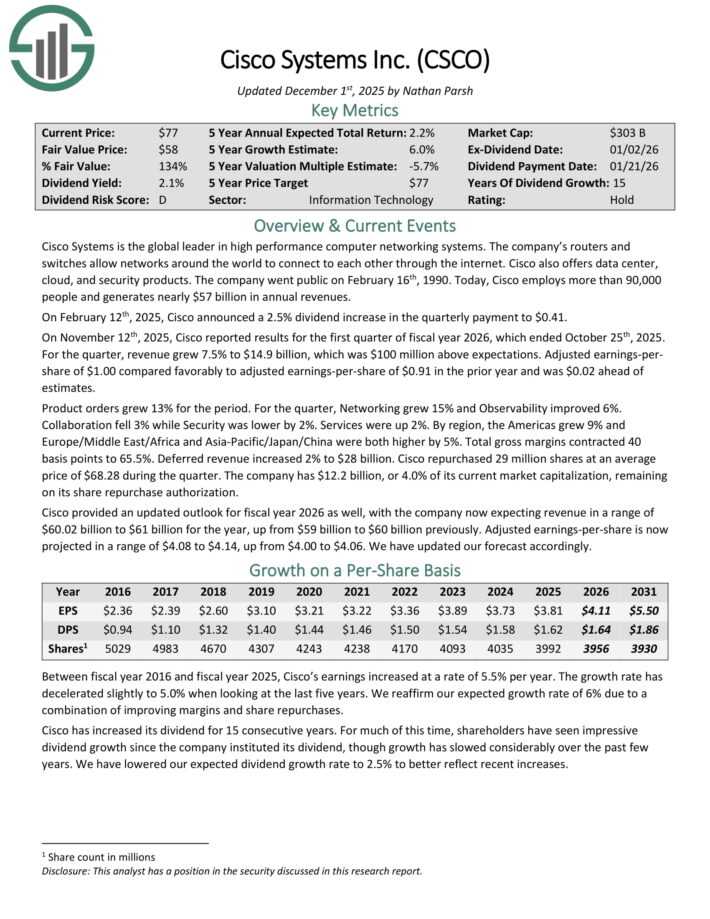
Cisco Systems is the global leader in high performance computer networking systems. The company’s routers and switches allow networks around the world to connect to each other through the internet.
Cisco also offers data center, cloud, and security products. Today, Cisco employs more than 90,000 people and generates nearly $57 billion in annual revenues.
On February 12th, 2025, Cisco announced a 2.5% dividend increase in the quarterly payment to $0.41.
On November 12th, 2025, Cisco reported results for the first quarter of fiscal year 2026, which ended October 25th, 2025. For the quarter, revenue grew 7.5% to $14.9 billion, which was $100 million above expectations.
Adjusted earnings-per-share of $1.00 compared favorably to adjusted earnings-per-share of $0.91 in the prior year and was $0.02 ahead of estimates.
Cisco repurchased 29 million shares at an average price of $68.28 during the quarter. The company has $12.2 billion, or 4.0% of its current market capitalization, remaining on its share repurchase authorization.
Cisco provided an updated outlook for fiscal year 2026 as well, with the company now expecting revenue in a range of $60.02 billion to $61 billion for the year, up from $59 billion to $60 billion previously.
Adjusted earnings-per-share is now projected in a range of $4.08 to $4.14.
Click here to download our most recent Sure Analysis report on CSCO (preview of page 1 of 3 shown below):
No. 9: Accenture plc (ACN)
Percentage of Portfolio: 3.5%
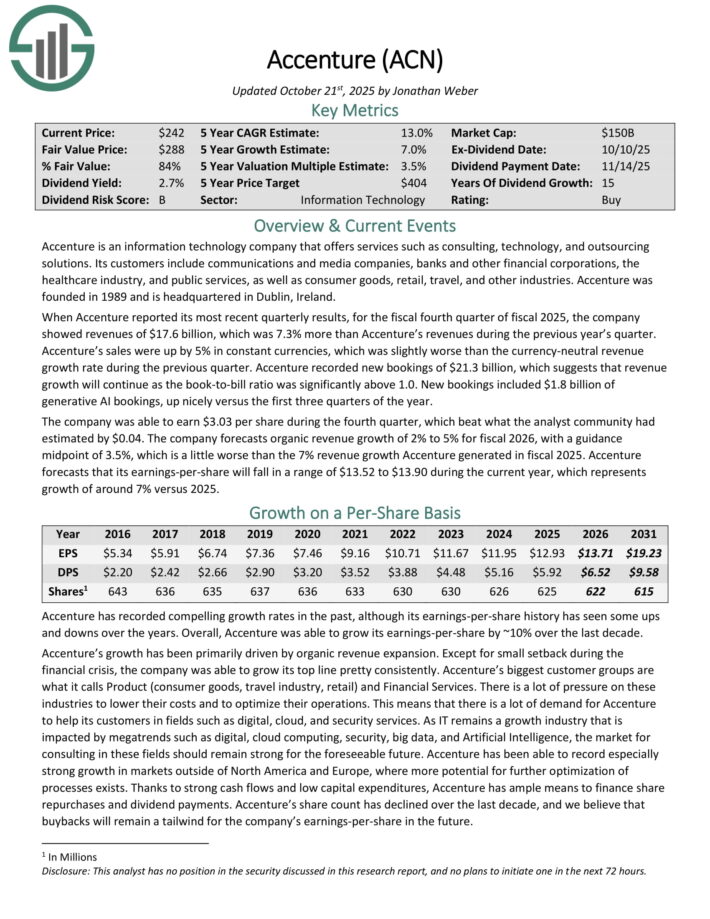
Accenture is an information technology company that offers services such as consulting, technology, and outsourcing solutions.
Its customers include communications and media companies, banks and other financial corporations, the healthcare industry, and public services, as well as consumer goods, retail, travel, and other industries. Accenture was founded in 1989 and is headquartered in Dublin, Ireland.
When Accenture reported its most recent quarterly results, for the fiscal fourth quarter of fiscal 2025, the company showed revenues of $17.6 billion, which was 7.3% more than Accenture’s revenues during the previous year’s quarter.
Accenture’s sales were up by 5% in constant currencies, which was slightly worse than the currency-neutral revenue growth rate during the previous quarter. Accenture recorded new bookings of $21.3 billion, which suggests that revenue growth will continue as the book-to-bill ratio was significantly above 1.0.
New bookings included $1.8 billion of generative AI bookings, up nicely versus the first three quarters of the year. The company was able to earn $3.03 per share during the fourth quarter, which beat what the analyst community had estimated by $0.04.
The company forecasts organic revenue growth of 2% to 5% for fiscal 2026, with a guidance midpoint of 3.5%, which is a little worse than the 7% revenue growth Accenture generated in fiscal 2025.
Accenture forecasts that its earnings-per-share will fall in a range of $13.52 to $13.90 during the current year, which represents growth of around 7% versus 2025.
Click here to download our most recent Sure Analysis report on ACN (preview of page 1 of 3 shown below):
No. 8: Microsoft Corporation (MSFT)
Percentage of OUSA Portfolio: 3.9%
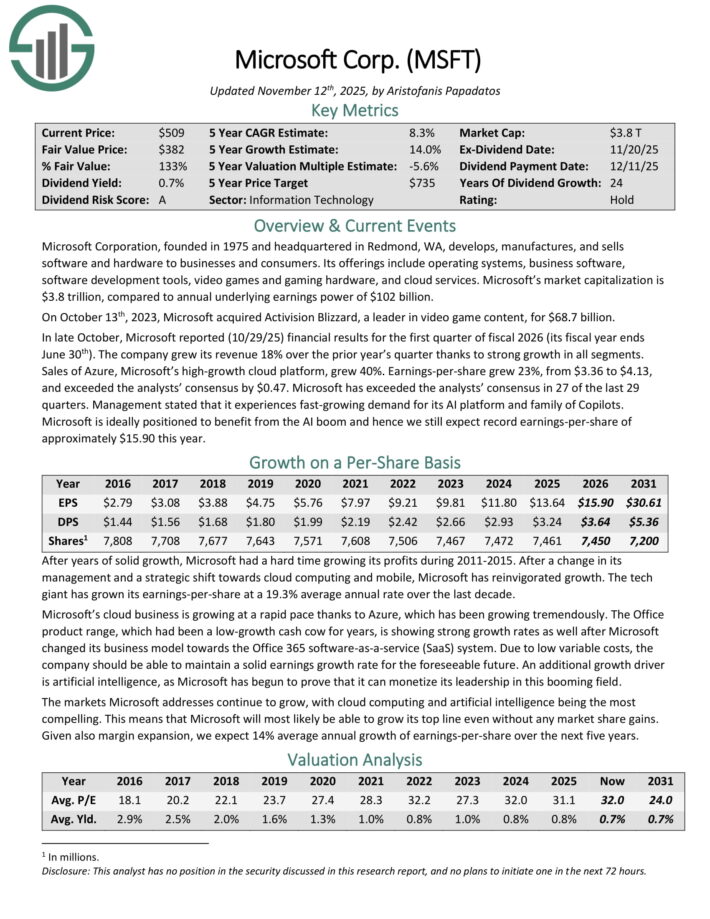
Microsoft Corporation manufactures and sells software and hardware to businesses and consumers. Its offerings include operating systems, business software, software development tools, video games and gaming hardware, and cloud services.
In late October, Microsoft reported (10/29/25) financial results for the first quarter of fiscal 2026 (its fiscal year ends June 30th). The company grew its revenue 18% over the prior year’s quarter thanks to strong growth in all segments.
Sales of Azure, Microsoft’s high-growth cloud platform, grew 40%. Earnings-per-share grew 23%, from $3.36 to $4.13, and exceeded the analysts’ consensus by $0.47. Microsoft has exceeded the analysts’ consensus in 27 of the last 29 quarters.
Microsoft’s cloud business is growing at a rapid pace thanks to Azure, which has been growing at a tremendous rate. The Office product range, which had been a low-growth cash cow for years, is showing strong growth rates as well after Microsoft changed its business model towards the Office 365 software-as-a-service (SaaS) system.
Click here to download our most recent Sure Analysis report on MSFT (preview of page 1 of 3 shown below):
No. 7: McDonald’s Corporation (MCD)
Percentage of OUSA Portfolio: 3.9%
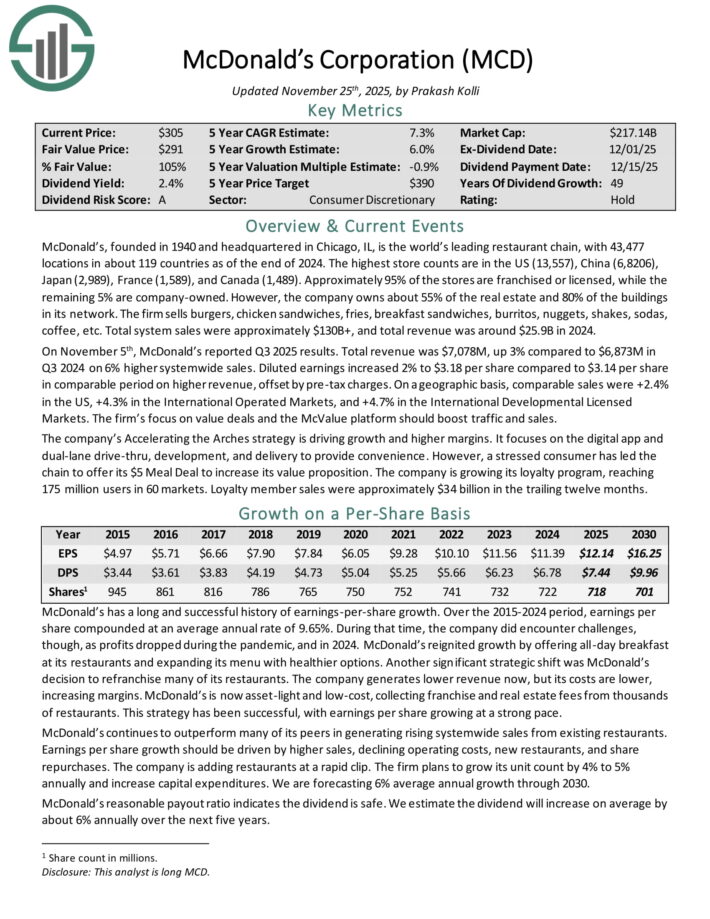
McDonald’s, founded in 1940 and headquartered in Chicago, IL, is the world’s leading restaurant chain with 43,477 locations in about 119 countries at end of 2024. The highest store counts are in the US (13,557), China (6,8206), Japan (2,989), France (1,589), and Canada (1,489).
Approximately 95% of the stores are franchised or licensed and the rest are company owned. However, the company owns about 55% of the real estate and 80% of the buildings in its network.
The firm sells burgers, chicken sandwiches, fries, breakfast sandwiches, burritos, nuggets, shakes, sodas, coffee, etc. Total system sales were approximately $130B+ and total revenue was around $25.9B in 2024.
On November 5th, McDonald’s reported Q3 2025 results. Total revenue was up 3% compared to Q3 2024 on 6% higher system-wide sales. Diluted earnings increased 2% to $3.18 per share compared to $3.14 per share in comparable period on higher revenue, offset by pre-tax charges.
On a geographic basis, comparable sales were +2.4% in the US, +4.3% in the International Operated Markets, and +4.7% in the International Developmental Licensed Markets.
The firm’s focus on value deals and the McValue platform should boost traffic and sales. The company’s Accelerating the Arches strategy is driving growth and higher margins. It focuses on the digital app and dual-lane drive-thru, development, and delivery to provide convenience.
Click here to download our most recent Sure Analysis report on MCD (preview of page 1 of 3 shown below):
No. 6: Home Depot (HD)
Percentage of OUSA Portfolio: 4.4%
Home Depot was founded in 1978 and since that time has grown into a juggernaut home improvement retailer with over 2,300 stores in the US, Canada and Mexico that generate around $153 billion in annual revenue.
On September 4th, 2025, the company completed its acquisition of GMS Inc., a specialty building products distributor, for $110 per share, for a total enterprise value of roughly $5.5 billion.
GMS merged into SRS, creating a network of over 1,200 locations and a fleet of over 8,000 trucks which could make 10,000+ jobsite deliveries per day.
Home Depot reported third quarter 2025 results on November 18th, 2025. The company reported sales of $41.4 billion, up 2.8% year-over-year. Comparable sales in the quarter rose 0.2%. Net earnings equaled $3.6 billion, or $3.62 per share, compared to $3.6 billion, or $3.67 per share in Q3 2024. Adjusted EPS was $3.74.
Average ticket improved 2.0% compared to last year, from $88.65 to $90.39. However, customer transactions fell 1.4% to 393.5 million. As of the end of 3Q25, Home Depot had cash and cash equivalents amounting to $1.7 billion.
Management updated its guidance for 2025, now expecting total sales growth of 3.0%, the addition of 12 new stores, and diluted EPS to decline by 6% from 2024..
Click here to download our most recent Sure Analysis report on HD (preview of page 1 of 3 shown below):

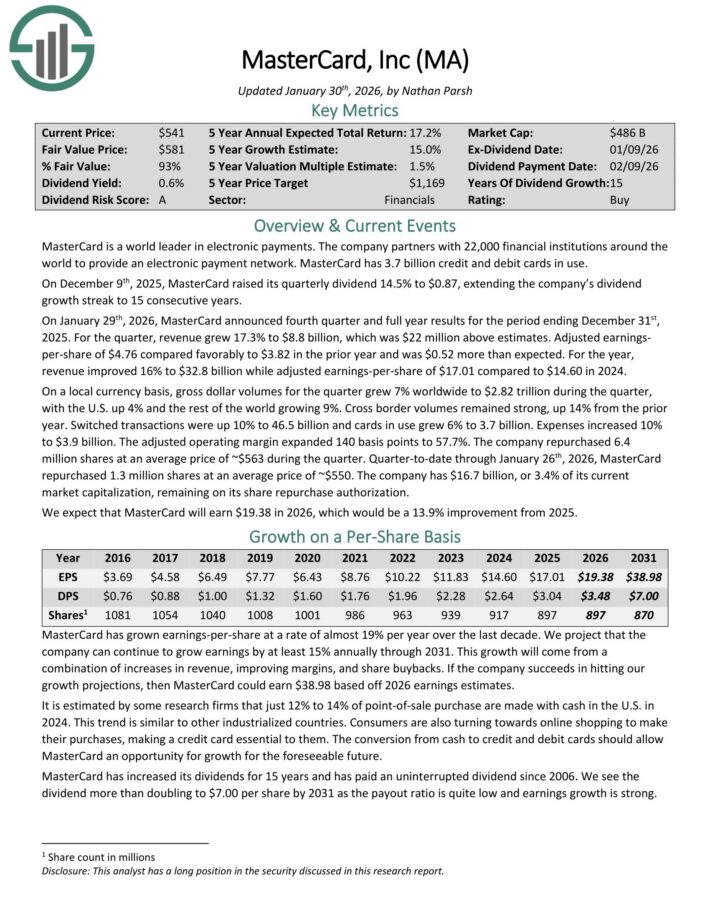
No. 5: MasterCard Inc. (MA)
Percentage of OUSA Portfolio: 4.5%
MasterCard is a world leader in electronic payments. The company partners with 25,000 financial institutions around the world to provide an electronic payment network. MasterCard has more than 3.1 billion credit and debit cards in use.
On January 29th, 2026, MasterCard announced fourth quarter and full year results for the period ending December 31st, 2025. For the quarter, revenue grew 17.3% to $8.8 billion, which was $22 million above estimates.
Adjusted earnings-per-share of $4.76 compared favorably to $3.82 in the prior year and was $0.52 more than expected.
For the year, revenue improved 16% to $32.8 billion while adjusted earnings-per-share of $17.01 compared to $14.60 in 2024.
On a local currency basis, gross dollar volumes for the quarter grew 7% worldwide to $2.82 trillion during the quarter, with the U.S. up 4% and the rest of the world growing 9%. Cross border volumes remained strong, up 14% from the prior year.
Quarter-to-date through January 26th, 2026, MasterCard repurchased 1.3 million shares at an average price of ~$550. The company has $16.7 billion, or 3.4% of its current market capitalization, remaining on its share repurchase authorization.
Click here to download our most recent Sure Analysis report on Mastercard (preview of page 1 of 3 shown below):
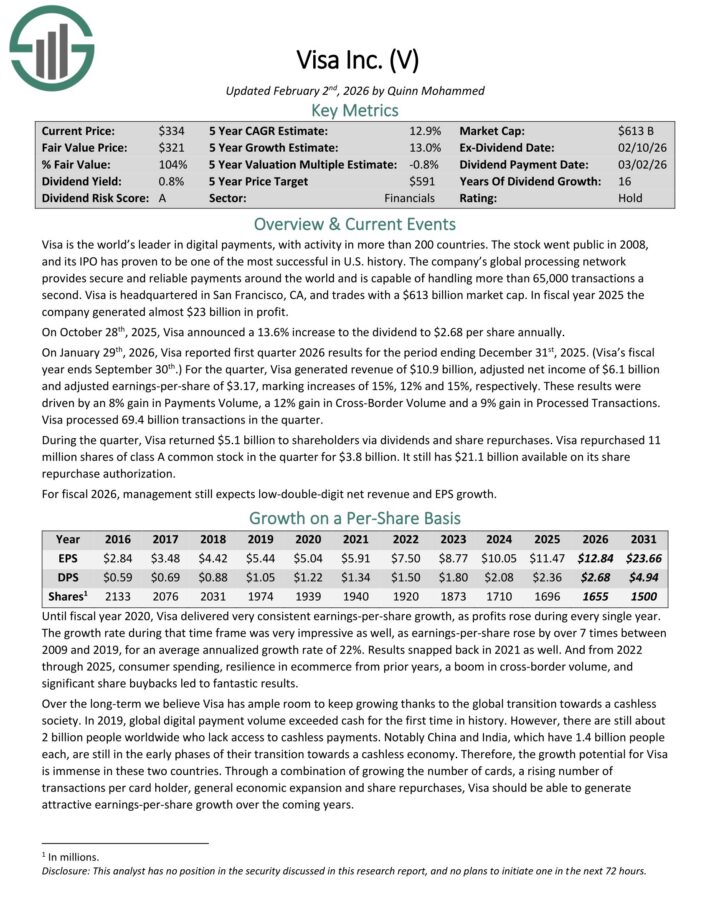
No. 4: Visa Inc. (V)
Percentage of OUSA Portfolio: 4.6%
Visa is the world’s leader in digital payments, with activity in more than 200 countries. The company’s global processing network provides secure and reliable payments around the world and is capable of handling more than 65,000 transactions a second.
On January 29th, 2026, Visa reported first quarter 2026 results for the period ending December 31st, 2025. For the quarter, Visa generated revenue of $10.9 billion, adjusted net income of $6.1 billion and adjusted earnings-per-share of $3.17, marking increases of 15%, 12% and 15%, respectively.
These results were driven by an 8% gain in Payments Volume, a 12% gain in Cross-Border Volume and a 9% gain in Processed Transactions. Visa processed 69.4 billion transactions in the quarter.
During the quarter, Visa returned $5.1 billion to shareholders via dividends and share repurchases. Visa repurchased 11 million shares of class A common stock in the quarter for $3.8 billion. It still has $21.1 billion available on its share repurchase authorization.
Click here to download our most recent Sure Analysis report on Visa (preview of page 1 of 3 shown below):
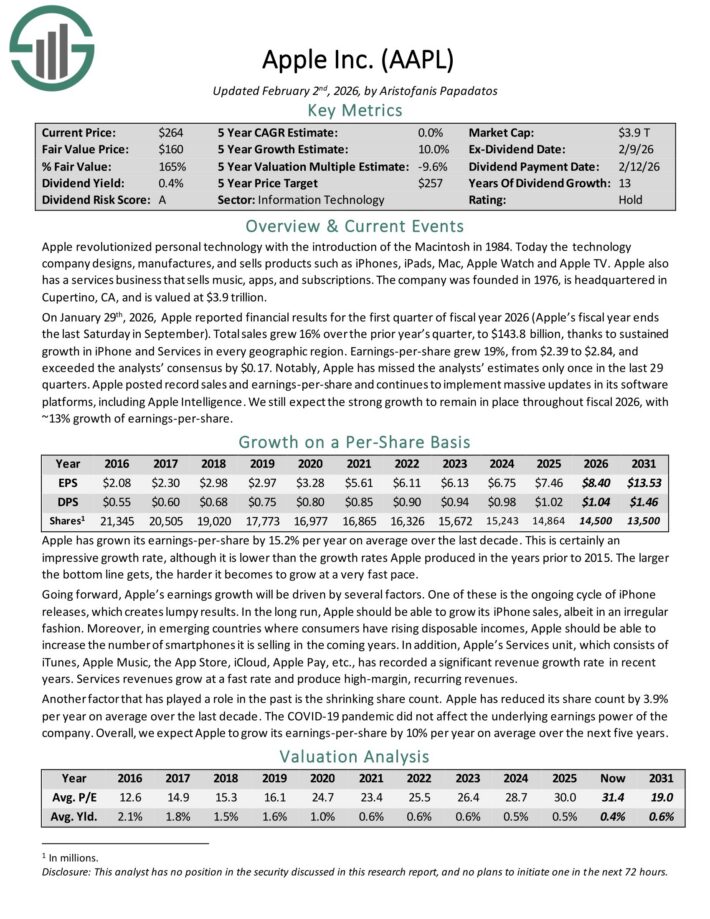
No. 3: Apple (AAPL)
Percentage of OUSA Portfolio: 4.8%
Apple is a technology company that designs, manufactures, and sells products such as iPhones, iPads, Mac, Apple Watch and Apple TV. Apple also has a services business that sells music, apps, and subscriptions.
On January 29th, 2026, Apple reported financial results for the first quarter of fiscal year 2026 (Apple’s fiscal year ends the last Saturday in September). Total sales grew 16% over the prior year’s quarter, to $143.8 billion, thanks to sustained growth in iPhone and Services in every geographic region.
Earnings-per-share grew 19%, from $2.39 to $2.84, and exceeded the analysts’ consensus by $0.17. Notably, Apple has missed the analysts’ estimates only once in the last 29 quarters.
Apple posted record sales and earnings-per-share and continues to implement massive updates in its software platforms, including Apple Intelligence.
Going forward, Apple’s earnings growth will be driven by several factors. One of these is the ongoing cycle of iPhone releases, which creates lumpy results. In the long run, Apple should be able to grow its iPhone sales, albeit in an irregular fashion.
Moreover, in emerging countries where consumers have rising disposable incomes, Apple should be able to increase the number of smartphones it is selling in the coming years.
In addition, Apple’s Services unit, which consists of iTunes, Apple Music, the App Store, iCloud, Apple Pay, etc., has recorded a significant revenue growth rate in recent years. Services revenues grow at a fast rate and produce high-margin, recurring revenues.
Click here to download our most recent Sure Analysis report on AAPL (preview of page 1 of 3 shown below):
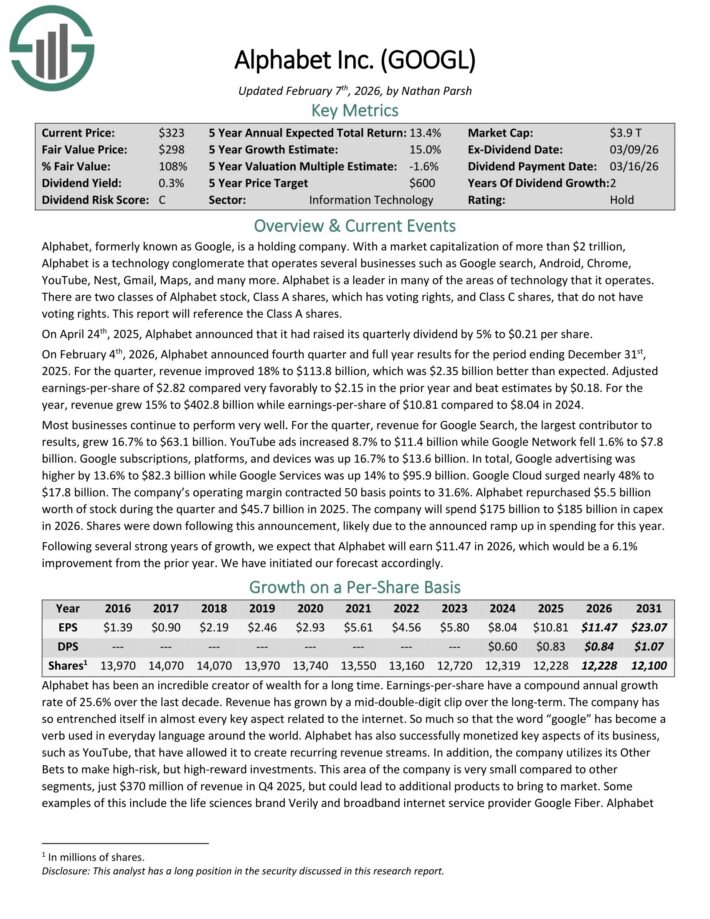
No. 2: Alphabet Inc. (GOOGL)
Percentage of OUSA Portfolio: 5.0%
Alphabet is a technology conglomerate that operates several businesses such as Google search, Android, Chrome, YouTube, Nest, Gmail, Maps, and many more. Alphabet is a leader in many of the areas of technology that it operates.
There are two classes of Alphabet stock, Class A shares, which has voting rights, and Class C shares, that do not have voting rights.
On April 24th, 2025, Alphabet announced that it had raised its quarterly dividend by 5% to $0.21 per share.
On February 4th, 2026, Alphabet announced fourth quarter and full year results for the period ending December 31st, 2025. For the quarter, revenue improved 18% to $113.8 billion, which was $2.35 billion better than expected.
Adjusted earnings-per-share of $2.82 compared very favorably to $2.15 in the prior year and beat estimates by $0.18. For the year, revenue grew 15% to $402.8 billion while earnings-per-share of $10.81 compared to $8.04 in 2024.
For the quarter, revenue for Google Search, the largest contributor to results, grew 16.7% to $63.1 billion. YouTube ads increased 8.7% to $11.4 billion while Google Network fell 1.6% to $7.8 billion. Google subscriptions, platforms, and devices was up 16.7% to $13.6 billion.
In total, Google advertising was higher by 13.6% to $82.3 billion while Google Services was up 14% to $95.9 billion. Google Cloud surged nearly 48% to $17.8 billion. The company’s operating margin contracted 50 basis points to 31.6%.
Alphabet repurchased $5.5 billion worth of stock during the quarter and $45.7 billion in 2025. We expect that Alphabet will earn $11.47 in 2026, which would be a 6.1% improvement from the prior year.
Click here to download our most recent Sure Analysis report on GOOGL (preview of page 1 of 3 shown below):
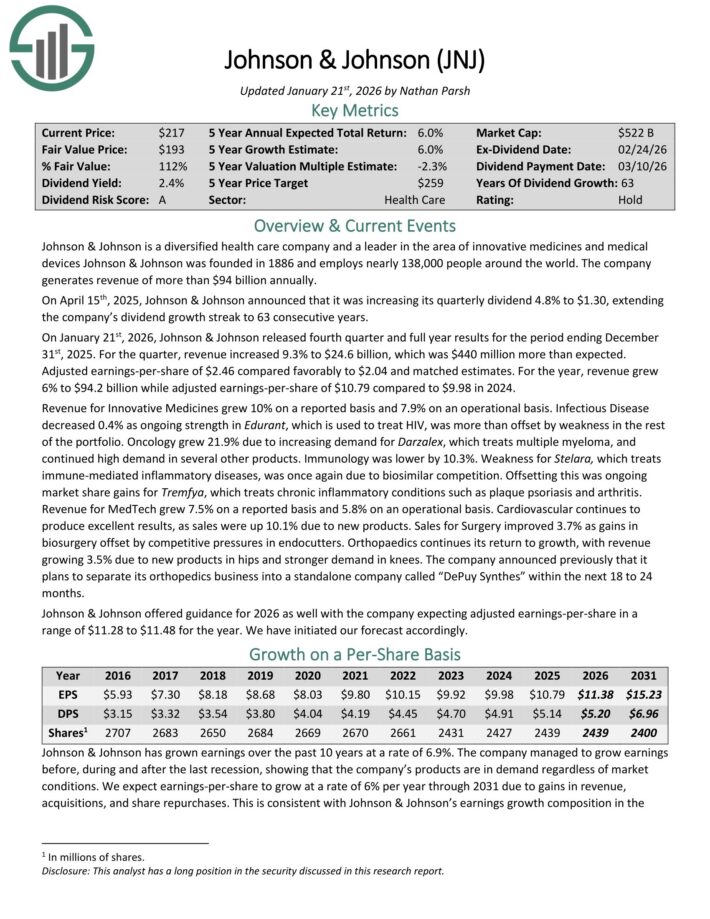
No. 1: Johnson & Johnson (JNJ)
Percentage of OUSA Portfolio: 5.3%
Johnson & Johnson is a diversified health care company and a leader in the area of innovative medicines and medical devices Johnson & Johnson was founded in 1886.
On January 21st, 2026, Johnson & Johnson released fourth quarter and full year results. For the quarter, revenue increased 9.3% to $24.6 billion, which was $440 million more than expected.
Adjusted earnings-per-share of $2.46 compared favorably to $2.04 and matched estimates. For the year, revenue grew 6% to $94.2 billion while adjusted earnings-per-share of $10.79 compared to $9.98 in 2024.
Revenue for Innovative Medicines grew 10% on a reported basis and 7.9% on an operational basis. Infectious Disease decreased 0.4% as ongoing strength in Edurant, which is used to treat HIV, was more than offset by weakness in the rest of the portfolio.
Oncology grew 21.9% due to increasing demand for Darzalex, which treats multiple myeloma, and continued high demand in several other products.
Johnson & Johnson offered guidance for 2026 as well with the company expecting adjusted earnings-per-share in a range of $11.28 to $11.48 for the year.
Click here to download our most recent Sure Analysis report on JNJ (preview of page 1 of 3 shown below):
Final Thoughts
Kevin O’Leary has become a household name due to his appearances on the TV show Shark Tank. But he is also a well-known asset manager, and his investment philosophy largely aligns with Sure Dividend’s.
Specifically, Mr. Wonderful typically invests in stocks with large and profitable businesses, with strong balance sheets and consistent dividend growth every year.
Not all of these stocks are currently rated as buys in the Sure Analysis Research Database, which ranks stocks based on expected total return due to a combination of earnings per share growth, dividends, and changes in the price-to-earnings multiple.
However, several of these 10 stocks are valuable holdings for a long-term dividend growth portfolio.
Additional Resources
If you are interested in finding more high-quality dividend growth stocks suitable for long-term investment, the following Sure Dividend databases will be useful:
The major domestic stock market indices are another solid resource for finding investment ideas. Sure Dividend compiles the following stock market databases and updates them monthly:
Thanks for reading this article. Please send any feedback, corrections, or questions to [email protected].


")

")


-1024x683.jpg "Florida Roads Become a Battleground for Illegal Immigration")


-1024x768.jpg "Red Snapper Used as Cudgel by Fed Judge")
 Has an Aftermarket and Rail-Modernization Platform Story Bigger Than a Freight Cycle Trade")


