
Published on November 17th, 2025 by Bob Ciura
Volatility is a proxy for risk; more volatility generally means a riskier portfolio. The volatility of a security or portfolio against the mean is called standard deviation.
In short, standard deviation is an investing metric that calculates the magnitude of a security’s dispersion from its average price over a given time period.
As a result, we believe standard deviation is an important financial metric that investors should familiarize themselves with, when purchasing individual stocks.
At the same time, investors can focus on stocks with low volatility as measured by standard deviation, that also have high dividend yields.
This creates an attractive combination of stability and income.
With this in mind, we have created a spreadsheet of over 200 stocks with dividend yields of 5% or more…
You can download your free full list of all high dividend stocks with 5%+ yields (along with important financial metrics such as dividend yield and payout ratio) by clicking on the link below:

Why this matters is because investors can utilize standard deviation to get a better understanding of a security’s volatility, and therefore its risk.
Importantly, low or high standard deviation measures the size of the movements a security could make from its average performance.
This article will discuss the 10 lowest standard deviation stocks in the Sure Analysis Research Database that also have high dividend yields above 5%.
The stocks are listed by annualized standard deviation over the past five years, in ascending order.
Table Of Contents
The table of contents below provides for easy navigation of the article:
Low Volatility High Dividend Stock #10: Sonoco Products Co. (SON)
Annualized 5-Year Standard Deviation: 19.5%
Sonoco Products provides packaging, industrial products and supply chain services to its customers. The markets that use the company’s products include those in the appliances, electronics, beverage, construction and food industries.
The company generates over $5 billion in annual sales. Sonoco Products is now composed of 2 major segments, Consumer Packaging, and Industrial Packaging, with all other businesses listed as “All Other”.
On April 16th, 2025, Sonoco Products raised its quarterly dividend 1.9% to $0.53, extending the company’s dividend growth streak to 49 consecutive years.
On July 23rd, 2025, Sonoco Products announced second quarter results for the period ending June 29th, 2025. For the quarter, revenue grew 17.9% to $1.91 billion, which was in-line with estimates. Adjusted earnings-per-share of $1.37 compared to $1.28 in the prior year, but was $0.08 less than expected.
Revenues and earnings benefited from the addition of Eviosys. For the quarter, Consumer Packaging revenues surged 110% to $1.23 billion, mostly due to contributions from Eviosys.
Volume growth was strong and favorable currency exchange rates also aided results. Industrial Paper Packing sales fell 2% to $588 million due to the impact of foreign currency exchange rates and lower volume following two plant divestitures in China last year.
Click here to download our most recent Sure Analysis report on Sonoco (SON) (preview of page 1 of 3 shown below):

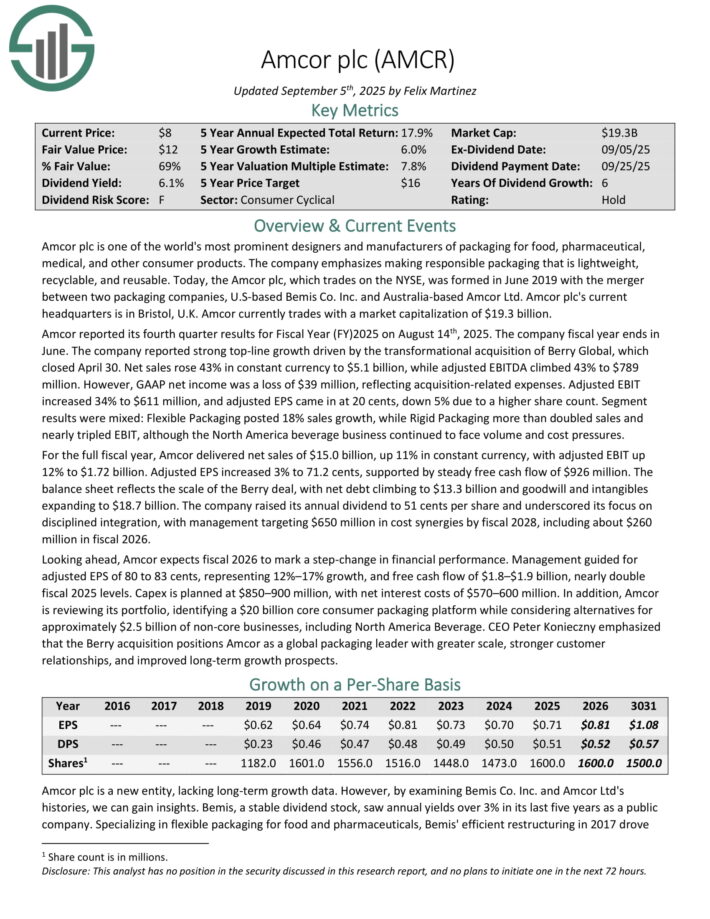
Low Volatility High Dividend Stock #9: Amcor plc (AMCR)
Annualized 5-Year Standard Deviation: 19.3%
Amcor plc is one of the world’s most prominent designers and manufacturers of packaging for food, pharmaceutical, medical, and other consumer products. The company emphasizes making responsible packaging that is lightweight, recyclable, and reusable.
Amcor reported its fourth quarter results for Fiscal Year 2025 on August 14th, 2025. The company fiscal year ends in June. The company reported strong top-line growth driven by the transformational acquisition of Berry Global, which closed April 30.
Net sales rose 43% in constant currency to $5.1 billion, while adjusted EBITDA climbed 43% to $789 million. However, GAAP net income was a loss of $39 million, reflecting acquisition-related expenses. Adjusted EBIT increased 34% to $611 million, and adjusted EPS came in at 20 cents, down 5% due to a higher share count.
Segment results were mixed: Flexible Packaging posted 18% sales growth, while Rigid Packaging more than doubled sales and nearly tripled EBIT, although the North America beverage business continued to face volume and cost pressures.
For the full fiscal year, Amcor delivered net sales of $15.0 billion, up 11% in constant currency, with adjusted EBIT up 12% to $1.72 billion. Adjusted EPS increased 3% to 71.2 cents, supported by steady free cash flow of $926 million.
The balance sheet reflects the scale of the Berry deal, with net debt climbing to $13.3 billion and goodwill and intangibles expanding to $18.7 billion.
The company raised its annual dividend to 51 cents per share and underscored its focus on disciplined integration, with management targeting $650 million in cost synergies by fiscal 2028, including about $260 million in fiscal 2026.
Click here to download our most recent Sure Analysis report on AMCR (preview of page 1 of 3 shown below):
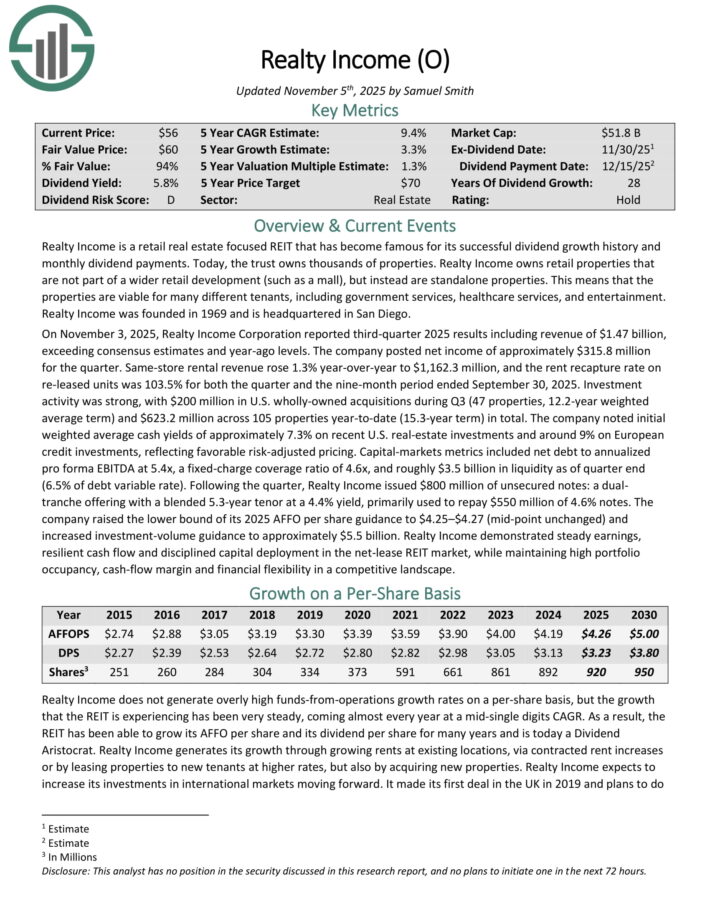
Low Volatility High Dividend Stock #8: Realty Income (O)
Annualized 5-Year Standard Deviation: 19.3%
Realty Income is a retail real estate focused REIT that has become famous for its successful dividend growth history and monthly dividend payments. Today, the trust owns thousands of properties.
Realty Income owns retail properties that are not part of a wider retail development (such as a mall), but instead are standalone properties. This means that the properties are viable for many different tenants, including government services, healthcare services, and entertainment.
On November 3, 2025, Realty Income Corporation reported third-quarter 2025 results including revenue of $1.47 billion, exceeding consensus estimates and year-ago levels.
The company posted net income of approximately $315.8 million for the quarter. Same-store rental revenue rose 1.3% year-over-year to $1,162.3 million, and the rent recapture rate on re-leased units was 103.5% for both the quarter and the nine-month period ended September 30, 2025.
Investment activity was strong, with $200 million in U.S. wholly-owned acquisitions during Q3 (47 properties, 12.2-year weighted average term) and $623.2 million across 105 properties year-to-date (15.3-year term) in total.
The company raised the lower bound of its 2025 AFFO per share guidance to $4.25–$4.27 (mid-point unchanged) and increased investment-volume guidance to approximately $5.5 billion.
Click here to download our most recent Sure Analysis report on O (preview of page 1 of 3 shown below):
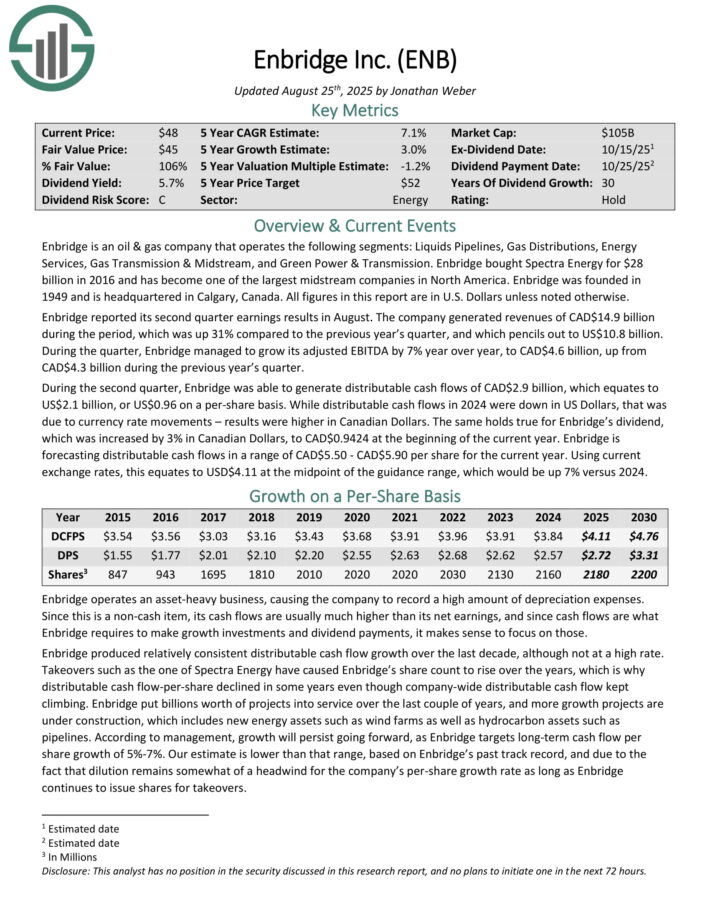
Low Volatility High Dividend Stock #7: Enbridge Inc. (ENB)
Annualized 5-Year Standard Deviation: 19.1%
Enbridge is an oil & gas company that operates the following segments: Liquids Pipelines, Gas Distributions, Energy Services, Gas Transmission & Midstream, and Green Power & Transmission.
Enbridge bought Spectra Energy for $28 billion in 2016 and has become one of the largest midstream companies in North America. Enbridge was founded in 1949 and is headquartered in Calgary, Canada.
During the second quarter, Enbridge was able to generate distributable cash flows of CAD$2.9 billion, which equates to US$2.1 billion, or US$0.96 on a per-share basis.
While distributable cash flows in 2024 were down in US Dollars, that was due to currency rate movements – results were higher in Canadian Dollars.
The same holds true for Enbridge’s dividend, which was increased by 3% in Canadian Dollars, to CAD$0.9424 at the beginning of the current year.
Enbridge is forecasting distributable cash flows in a range of CAD$5.50 – CAD$5.90 per share for the current year.
Click here to download our most recent Sure Analysis report on ENB (preview of page 1 of 3 shown below):
Low Volatility High Dividend Stock #6: Verizon Communications (VZ)
Annualized 5-Year Standard Deviation: 18.9%
Verizon Communications is one of the largest wireless carriers in the country. Wireless contributes three-quarters of all revenues, and broadband and cable services account for about a quarter of sales. The company’s network covers ~300 million people and 98% of the U.S.
On September 5th, 2025, Verizon announced that it was increasing its quarterly dividend 1.8% to $0.69 for the November 3rd, 2025 payment, extending the company’s dividend growth streak to 21 consecutive years.
On October 29th, 2025, Verizon reported third quarter results for the period ending September 30th, 2025. For the quarter, revenue grew 1.5% to $33.8 billion, but this was $470 million below estimates. Adjusted earnings-per-share of $1.21 compared favorably to $1.19 in the prior year and was $0.02 better than expected.
For the quarter, Verizon Consumer had postpaid phone net losses of 7,000, which compares to net additions of 18,000 in the same period of last year. However, wireless retail core prepaid net additions grew 47,000, marking the fifth consecutive quarter of positive subscriber growth.
Consumer wireless retail postpaid phone churn rate remains low at 0.91%. The Consumer segment grew 2.9% to $26.1 billion while consumer wireless service revenue increased 2.4% to $17.4 billion. Consumer wireless postpaid average revenue per account grew 2.0% to $147.91.
Broadband totaled 306K net new customers during the period, which marks 13 consecutive quarters of at least 300K net adds. The total fixed wireless customer base is almost 5.4 million. Verizon aims to have 8 to 9 million fixed wireless subscribers by 2028.
Wireless retail postpaid net additions were 110K for the period. Free cash flow was $15.8 billion for the first three quarters of the year, up from $14.5 billion for the same period in 2024.
Verizon reaffirmed prior guidance for 2025 as well, with the company still expecting wireless service revenue to grow 2% to 2.8% for the year. Verizon is also expected to produce adjusted EPS growth in a range of 1% to 3%.
Click here to download our most recent Sure Analysis report on VZ (preview of page 1 of 3 shown below):

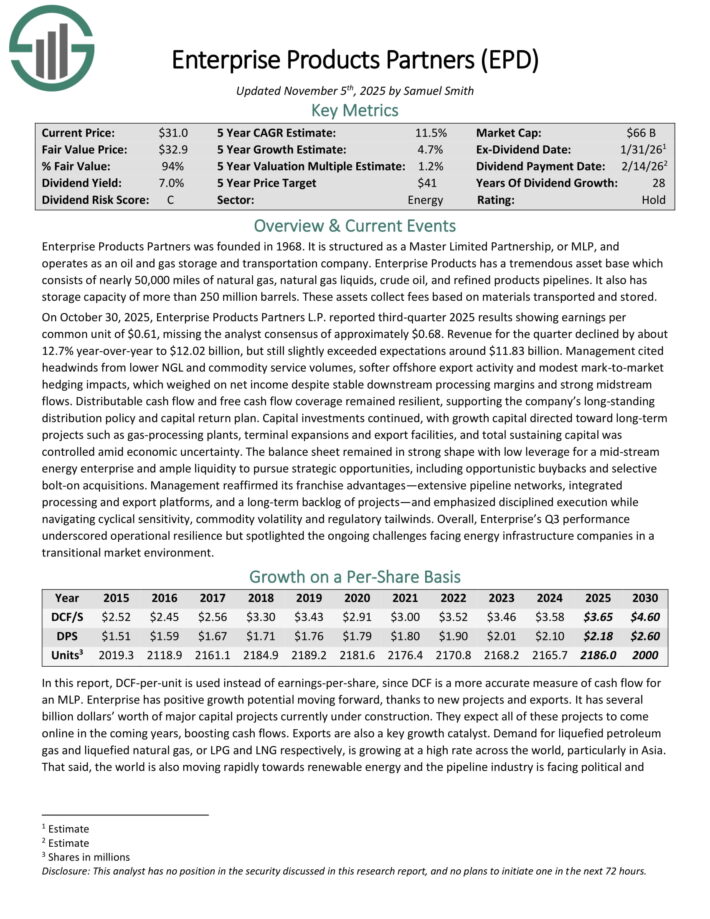
Low Volatility High Dividend Stock #5: Enterprise Products Partners LP (EPD)
Annualized 5-Year Standard Deviation: 18.8%
Enterprise Products Partners was founded in 1968. It is structured as a Master Limited Partnership, or MLP, and operates as an oil and gas storage and transportation company.
Enterprise Products has a tremendous asset base which consists of nearly 50,000 miles of natural gas, natural gas liquids, crude oil, and refined products pipelines. It also has storage capacity of more than 250 million barrels. These assets collect fees based on materials transported and stored.
On October 30, 2025, Enterprise Products Partners L.P. reported third-quarter 2025 results showing earnings per common unit of $0.61, missing the analyst consensus of approximately $0.68. Revenue for the quarter declined by about 12.7% year-over-year to $12.02 billion, but still slightly exceeded expectations around $11.83 billion.
Management cited headwinds from lower NGL and commodity service volumes, softer offshore export activity and modest mark-to-market hedging impacts, which weighed on net income despite stable downstream processing margins and strong midstream flows.
Click here to download our most recent Sure Analysis report on EPD (preview of page 1 of 3 shown below):
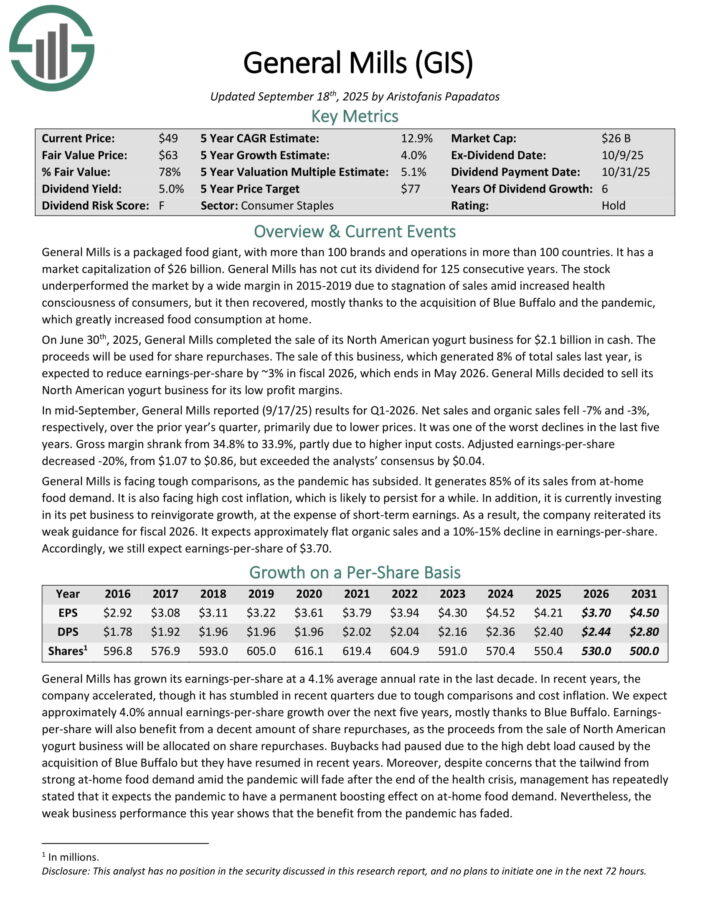
Low Volatility High Dividend Stock #4: General Mills (GIS)
Annualized 5-Year Standard Deviation: 18.5%
General Mills is a packaged food giant, with more than 100 brands and operations in more than 100 countries. It has a market capitalization of $26 billion. General Mills has not cut its dividend for 125 consecutive years.
On June 30th, 2025, General Mills completed the sale of its North American yogurt business for $2.1 billion in cash. The proceeds will be used for share repurchases.
The sale of this business, which generated 8% of total sales last year, is expected to reduce earnings-per-share by ~3% in fiscal 2026, which ends in May 2026. General Mills decided to sell its North American yogurt business for its low profit margins.
In mid-September, General Mills reported (9/17/25) results for Q1-2026. Net sales and organic sales fell -7% and -3%, respectively, over the prior year’s quarter, primarily due to lower prices.
It was one of the worst declines in the last five years. Gross margin shrank from 34.8% to 33.9%, partly due to higher input costs.
Adjusted earnings-per-share decreased -20%, from $1.07 to $0.86, but exceeded the analysts’ consensus by $0.04. General Mills is facing tough comparisons, as the pandemic has subsided.
It generates 85% of its sales from at-home food demand. It is also facing high cost inflation, which is likely to persist for a while.
In addition, it is currently investing in its pet business to reinvigorate growth, at the expense of short-term earnings. As a result, the company reiterated its weak guidance for fiscal 2026.
It expects approximately flat organic sales and a 10%-15% decline in earnings-per-share.
Click here to download our most recent Sure Analysis report on GIS (preview of page 1 of 3 shown below):
Low Volatility High Dividend Stock #3: TELUS Corp. (TU)
Annualized 5-Year Standard Deviation: 18.4%
TELUS Corporation is one of the ‘big three’ Canadian telecommunications companies along with BCE, Inc. (BCE) and Rogers Communications (RCI).
TELUS is focused in Western Canada and provides a full range of communication products and services through two business segments: Wireline and Wireless.
In early November, TELUS reported (11/7/25) financial results for the third quarter of fiscal 2025. The company posted decent customer growth.
It posted total mobile customer growth of 82,000, growth of fixed customers by 206,000 and a healthy churn rate of 0.91% at its postpaid mobile business.
However, revenue remained essentially flat over the prior year’s quarter. Earnings-per-share declined -15%, from $0.20 to $0.17, mostly due to thinner operating margins.
Management now expects growth of revenue towards the low end of its guidance for 2%-4% and reiterated its guidance for 3%-5% growth of adjusted EBITDA in 2025.
Click here to download our most recent Sure Analysis report on TU (preview of page 1 of 3 shown below):

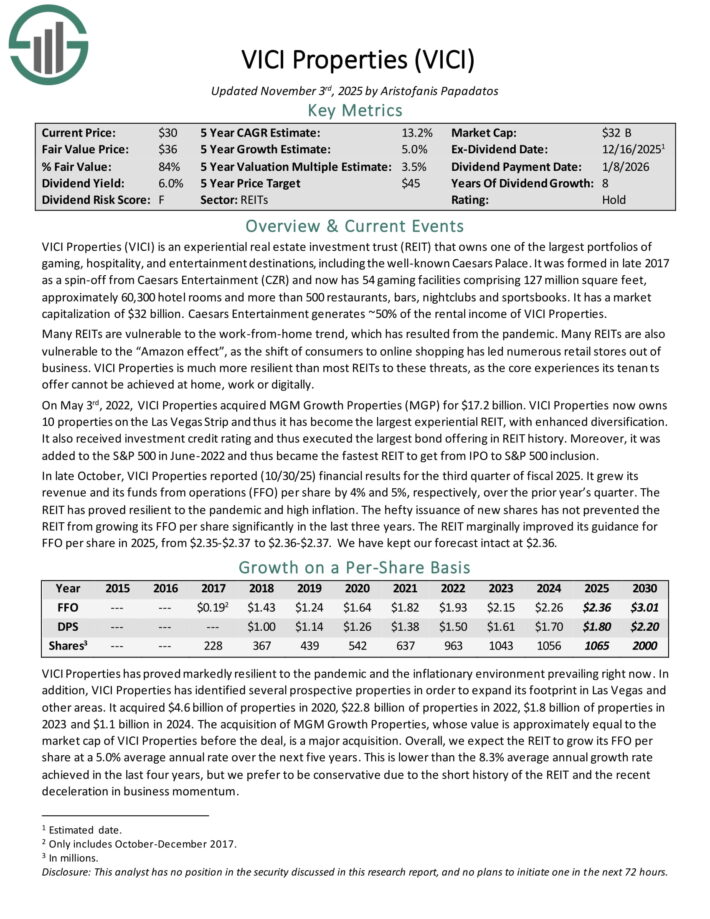
Low Volatility High Dividend Stock #2: VICI Properties (VICI)
Annualized 5-Year Standard Deviation: 18.1%
VICI Properties is an experiential real estate investment trust (REIT) that owns one of the largest portfolios of gaming, hospitality, and entertainment destinations, including the well-known Caesars Palace.
It now has 54 gaming facilities comprising 127 million square feet, approximately 60,300 hotel rooms and more than 500 restaurants, bars, nightclubs and sportsbooks.
Caesars Entertainment generates ~50% of the rental income of VICI Properties.
In late October, VICI Properties reported (10/30/25) financial results for the third quarter of fiscal 2025. It grew its revenue and its funds from operations (FFO) per share by 4% and 5%, respectively, over the prior year’s quarter.
The REIT has proved resilient to the pandemic and high inflation. The hefty issuance of new shares has not prevented the REIT from growing its FFO per share significantly in the last three years.
The REIT marginally improved its guidance for FFO per share in 2025, from $2.35-$2.37 to $2.36-$2.37.
Click here to download our most recent Sure Analysis report on VICI (preview of page 1 of 3 shown below):
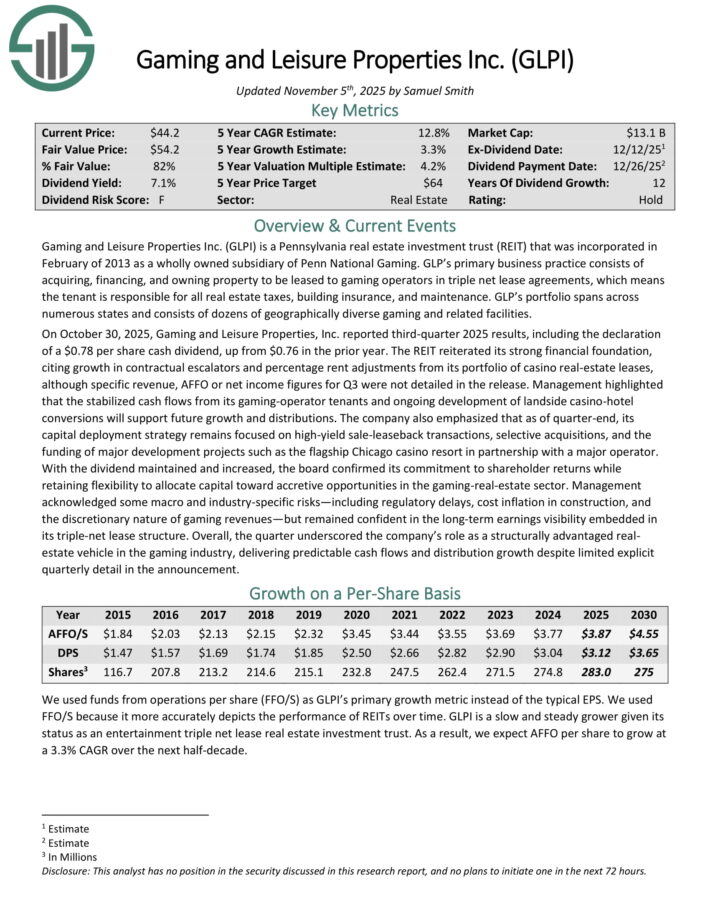
Low Volatility High Dividend Stock #1: Gaming & Leisure Properties (GLPI)
Annualized 5-Year Standard Deviation: 16.6%
Gaming and Leisure Properties is a Pennsylvania real estate investment trust (REIT) that was incorporated in February of 2013 as a wholly owned subsidiary of Penn National Gaming.
GLP’s primary business practice consists of acquiring, financing, and owning property to be leased to gaming operators in triple net lease agreements, which means the tenant is responsible for all real estate taxes, building insurance, and maintenance.
GLP’s portfolio spans across numerous states and consists of dozens of geographically diverse gaming and related facilities.
On October 30, 2025, Gaming and Leisure Properties, Inc. reported third-quarter 2025 results, including the declaration of a $0.78 per share cash dividend, up from $0.76 in the prior year.
The REIT reiterated its strong financial foundation, citing growth in contractual escalators and percentage rent adjustments from its portfolio of casino real-estate leases, although specific revenue, AFFO or net income figures for Q3 were not detailed in the release.
Click here to download our most recent Sure Analysis report on GLPI (preview of page 1 of 3 shown below):
Additional Reading
If you are interested in finding high-quality dividend growth stocks and/or other high-yield securities and income securities, the following Sure Dividend resources will be useful:
High-Yield Individual Security Research
Other Sure Dividend Resources
Thanks for reading this article. Please send any feedback, corrections, or questions to [email protected].

")
")


