

Average home prices remain very close to the all-time highs reached at the beginning of the year. Accordingly, public opinion surveys show rising concern about the issue of housing affordability, and politicians are taking notice. The Trump administration has waded in with a potentially forthcoming national housing emergency declaration so the President can do… something. We may have to wait until a decree is issued to see what exactly Mr. Trump thinks his emergency powers are in the realm of housing policy.
But are houses really more expensive over the long run, or is it just an economic mirage? As an economist with a background in residential construction, I think about this issue often.
When I read articles about the housing affordability crisis, I tend to agree with the economically-informed consensus that America has a fundamental housing supply problem. A combination of regulatory constraints—zoning, permitting, energy-efficiency standards, occupational licensing, etc.—raises home construction costs. Tariffs and the purge of illegal immigrant labor are not helping, either. I endorse the argument that regulatory easing would make housing significantly more affordable.
On the other hand, I sense that much of the fuss about ever-rising home prices is based on incomplete analysis. It does not account for enough of the relevant factors to provide a satisfactory explanation of the observed trends in the data. Good economic analysis must hold other factors constant—the famous ceteris paribus assumption. When it comes to home price analysis, there’s a raft of other factors to consider. Some fairly simple calculations with easily available data support an argument that home prices are not significantly higher than their long-run average.
The Other Factors that Matter in Housing
So what are the ceteris we must hold paribus when analyzing long-run trends in US home prices? Let’s start with the big, obvious one: inflation. We can’t compare nominal home prices from 2019 to 2025 (CPI grew 26% over these six years alone), much less from 1990 or 1960 or whatever date one selects as the golden age of affordability.
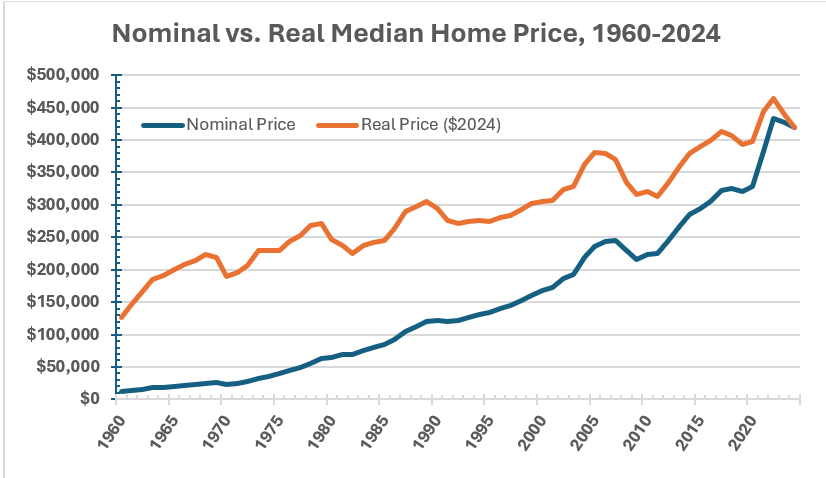
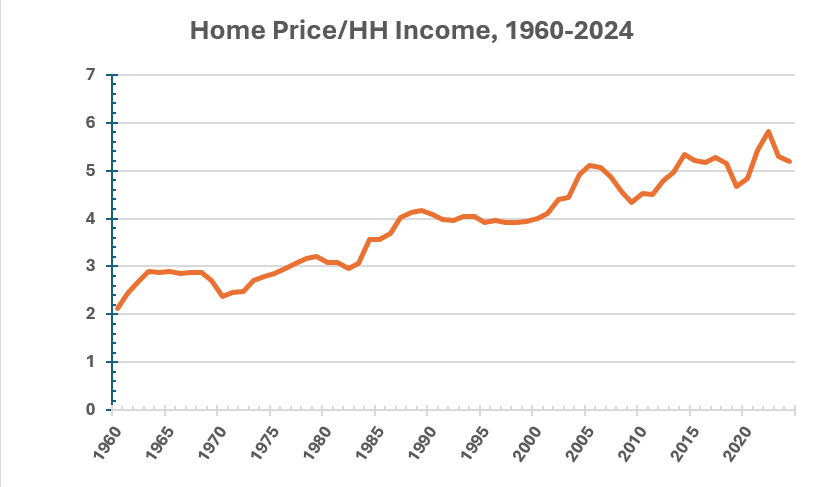
Let 1960 (the earliest year for which I can obtain data points for all of my ceteris paribus categories) represent the paragon of home affordability in the US. While the nominal median home price rose by 3,421% from 1960 to 2024, adjusting this for inflation using the Consumer Price Index shows a more modest but perhaps still distressing rise of 232%. But let’s now also factor in much smaller, but significant, growth in household incomes over this time frame. The typical practice is to divide the median home price by the median household income to get the home price/ household income ratio. In real terms, this ratio rose from about 2.1 to about 5.2, or 145%, over the same time frame.
Next, let’s consider what, exactly, people are getting with their purchase of the median home. In 1960, the median home built in the US was 1,500 square feet. Median home size rose steadily, peaking at about 2,700 square feet in the mid-2010s before declining slightly to 2,400 square feet in 2024. Assuming bigger is better and that people are happy to shell out more money for more house, we can adjust for this size factor by calculating real home price per square foot of home size. This metric increased by 107% from 1960 to 2024. Still a large increase, but far more manageable than that raw real median price by itself or adjusted merely for household incomes.

We’re getting closer, but I want this to be a comprehensive adjustment. One very important analytical factor I learned from the great Thomas Sowell is to be on the lookout for composition effects, or changes in the characteristics of groups over time that can skew simplistic statistical snapshots. Sowell teaches us to be on the lookout for composition effects in any household statistic, because household size can and does change significantly over time. In 1960, the average US household was 3.33 people. This figure dropped to about 2.5 by the 2020s, with most of that decline taking place before the 1990s.
This means that the median household income is divided amongst a smaller number of household members, understating the growth of household income over time on a personal level. In other words, real median household income per person went up by more than is apparent in the overall household income data series. We can factor this into our home price analysis by calculating the ratio of real home price to real household income per person. This metric rose by 96% over the 1960–2024 period.

Finally, let’s combine the change in home size along with the change in household composition in that last calculation. Our final adjustment results in the ratio of real home price per square foot to real household income per person. Drumroll, please: by this comprehensively adjusted metric, housing affordability rose by a paltry 6% from 1960 to 2024, and is actually down substantially from its peak in the late 1970s.

Moreover, all of these adjustments do not account for perhaps the most important change: that of home quality in terms of features and amenities that have become more common over the years. I have yet to find an index of home quality that tracks these attributes in a reliable way. I do have a strong impression, based on personal experience and tidbits of data, from which I arrive at a confident conclusion that today’s homes are nicer places to live than those of 30 or 60 years ago. As a 2011 US Census report summarizes, in addition to larger home sizes, “homes built today have almost more of everything—different types of rooms such as more bedrooms and bathrooms, more amenities such as washers and dryers, garbage disposals and fireplaces, and more safety features, such as smoke and carbon monoxide detectors and sprinkler systems.” Today’s bigger, roomier homes also have more energy-efficient utilities, more user-friendly appliances, more garage space, bigger and more well-appointed kitchens where stone countertops replaced Formica, and so on. If we could find a way to factor in all of these changes to the comprehensive home price adjustment, it might show zero change or even a fall in home prices, ceteris paribus.
In conclusion, the housing affordability crisis is a nothingburger!
While it’s important to think carefully about the changes in the ceteris, I want to reiterate that there is a housing price problem, and it deserves attention and a smart public policy response. I hope my “comprehensive” real home price adjustments here are thought-provoking, but this analysis is lacking in at least two major ways: 1. It cherry picks the start and end points; 2. It’s national aggregate data, so it does not pick up regional variations in home price changes over time.
If you look at ten-year spans, there’s a lot of fluctuation in home price shifts, even by my preferred ratio of real home price per square foot to real household income per person metric. 2024 prices were 22% higher than 10 years prior, giving the up-and-coming generation ample grounds to complain that home prices are getting out of reach. The recent spurt of home appreciation also validates the complaint that housing markets serve to transfer wealth from poorer millennials to well-off boomers. Housing price growth also varies greatly by region. Hot markets—mostly coastal and sunbelt metros—saw 10-year price growth at 1.5 to 2 times larger than the national average. Cooler markets in parts of the south and Midwest saw growth rates not much higher than overall CPI inflation.
As this excellent map from Visual Capitalist shows, it is much easier to afford a house (ceteris paribus, of course!) in the Midwest than in the West, Northeast, or Florida. (I knew there had to be a compensating differential for our miserable Michigan winters!)
Getting a handle on escalating home prices is a simple, but not politically easy, fix. We need to claw back the relative growth in home construction costs. In other words, we need the housing supply curve to “shift to the right” more than the demand curve has shifted. Builders know exactly what this would take: less restrictive zoning (especially for multifamily units), easier licensing and permitting processes, less stringent building codes and energy standards, freer markets in labor and materials, and maybe a consumer acceptance of smaller, simpler homes.
All data sourced from Federal Reserve Economic Data: fred.stlouisfed.org.Dataset and calculations available upon request: [email protected]
Tyler Watts is a professor of economics at Ferris State University.


")


")
